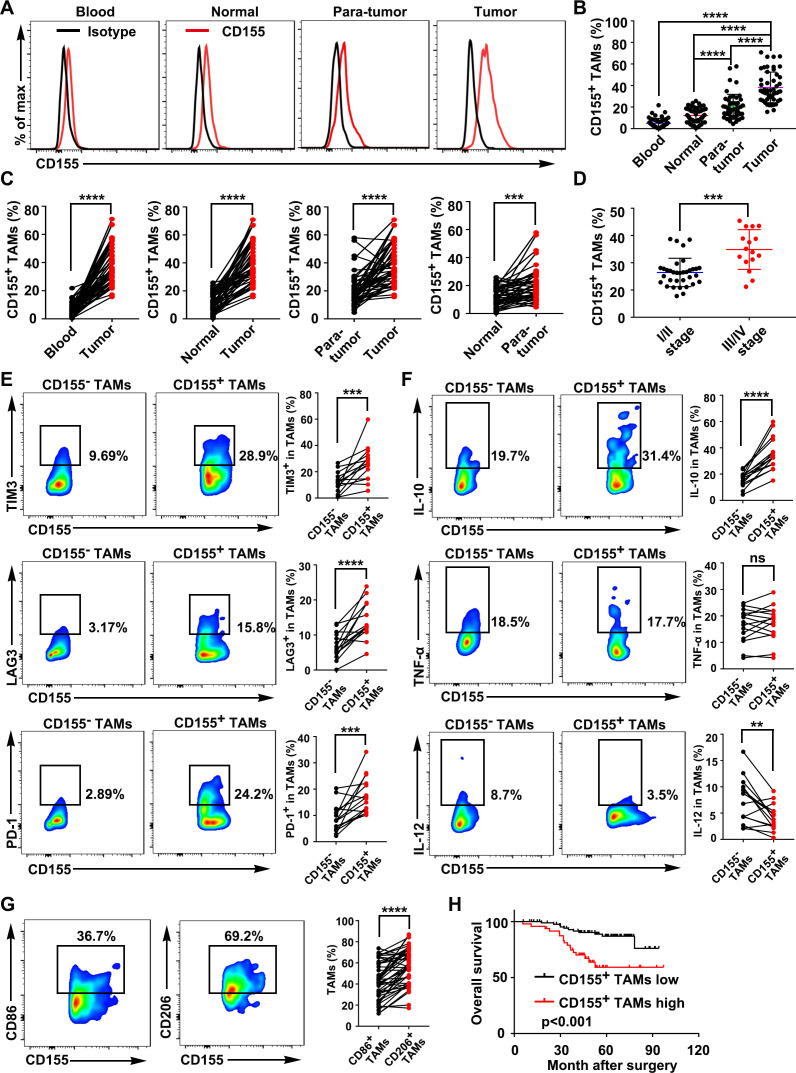
Figure 1.
CD155+ TAMs were predominant in CRC tissue and showed an M2 macrophage phenotype. (A) Representative FACS images showed the expression patterns of CD155 on macrophages from the paired blood samples, normal tissues, paratumor tissues, and tumor tissues of patients with CRC (gated on CD68+ cells). (B) Quantitative analysis of CD155+ macrophages from the FACS analysis (n=50). (C) Percentage of CD155+ macrophages presented in paired blood samples and tumors, paired normal tissues and tumors, paired paratumor tissues and tumor tissues, and paired normal tissues and paratumor tissues of patients with CRC (n=50). (D) Percentage of CD155+ TAMs in CRC tissue of patients with tumor stages I/II and III/IV. (E) Expression pattern of TIM-3, LAG-3, and PD-1 on CD155– and CD155+ TAMs presented in CRC tissues (n=15). (F) Expression pattern of IL-10, TNF-α, and IL-12 in CD155– and CD155+ TAMs presented in CRC tissues (n=15). (G) Expression pattern of the M1 phenotype marker CD86 and the M2 phenotype marker CD206 in CD155+ TAMs (n=50). (H) Kaplan-Meier analysis of overall survival according to low and high CD155 expression in 141 patients with CRC. Data were presented as mean±SD. A significant difference between the groups, **p<0.01, ***p<0.001, and ****p<0.0001. CRC, colorectal cancer; FACS, fluorescence activated cell sorter; IL, interleukin; LAG-3, lymphocyte-activation gene 3; ns, no significant difference; PD-1, programmed cell death protein-1; TAM, tumor-associated macrophages; TIM-3, T-cell immunoglobulin and mucin domain 3; TNF, tumor necrosis factor.

