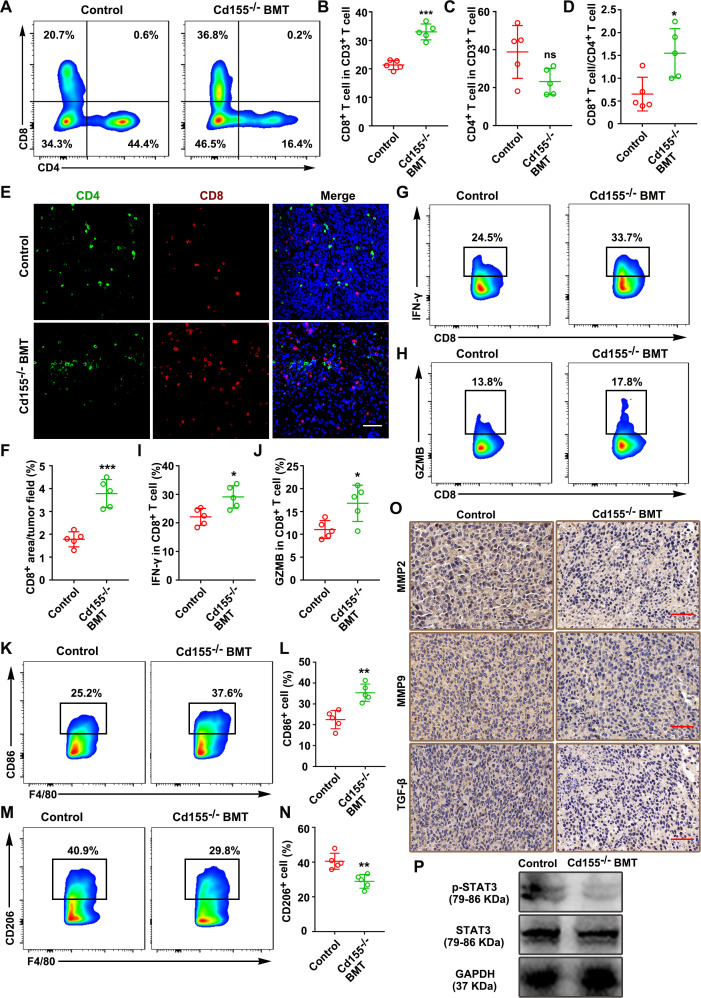
Figure 7.
CD155–⁄– BMT promoted the antitumor immune response in the mouse ectopic CRC model. Number of CD8+ and CD4+ T cells (A–C), and CD8+/CD4+ T-cell ratio (D), in mouse tumor tissues examined by flow cytometry (gated on CD3+ cells). (E and F) Representative immunofluorescence images of CD4 and CD8 expressing cells in tumor tissues. Scale bar: 50 µm. (G–J) Expression pattern of IFN-γ and GZMB in CD8+ T cells of tumor tissue. CD86 (K and L) and CD206 expression patterns (M and N) of TAMs in tumor tissues (gated on F4/80+ cells). (O) Representative microscopic images of MMP2 (IHC), MMP9 (IHC), and TGF-β (IHC) in tumor tissues. Scale bar: 50 µm. (P) Expression pattern of pSTAT3/STAT3 in tumor tissues. Data were presented as mean±SD, n=5. A significant difference between the groups, *p<0.05, **p<0.01, and ***p<0.001. BMT, bone marrow transplantation; CRC, colorectal cancer; GZMB, granzyme B; IFN, interferon; IHC, immunohistochemistry; MMP, matrix metalloproteinases; ns, no significant difference; TAM, tumor-associated macrophages.

