

Abstract
Wastewater treatment is an unavoidable necessity and requires immediate action with the aim of saving future generations from water crises and ensuring the sustainability of clean and drinkable water. In the present work, green synthesis of iron oxide nanoparticles (IONPs) was carried out from fruit extract of Hylocereus undatus to observe its photocatalytic activity towards two azo dyes, namely, Metanil yellow and Orange II dye. IONPs served as an efficient photocatalyst for the degradation of Metanil yellow dye, and the reaction followed pseudo-first-order kinetics. The effect of the initial dye concentration, amount of photocatalyst added, and effect of pH on photocatalytic degradation of Metanil yellow and Orange II dye using IONPs was studied. The results were compiled to reveal the most effective conditions for degradation to occur. A computational study of two dyes using DFT (Density Functional Theory) calculations were also performed to calculate thermodynamic properties such as the free energy, dipole moment, HOMO–LUMO energy gap, chemical potential, global hardness, softness, global electrophilicity index, ionization potential, electron affinity, etc. These parameters were used to describe the reactivity of dye toward the active photocatalytic species responsible for the degradation of dye. Natural population analysis was also performed, and Fukui indices were also calculated to explain the possible attacking sites of dyes by active photocatalytic species.
1. Introduction
Freshwater is vital for the existence of life on Earth, but the quality of water is depreciating as the number of effluents and other pollutants discharged into the water bodies is increasing hastily with the growth of population in addition to the change in lifestyle of humans. According to a World Health Organization (WHO) report published on June 14, 2019, 785 million people lack even basic drinking water services and nearly half of the world’s population will be living in water-stressed areas by 2025. Textile dyeing and treatment constitute about 17–18% of water pollution. Dyes enter the food chains through water and can cause severe allergic reactions and, in worse cases, can lead to various respiratory and neurological disorders.1 Dyes not only pose threat to human life but are also known to develop teratogenicity, genotoxicity, and carcinogenicity in marine animals.2 Phytotoxicity is also witnessed in plants when irrigated or cultivated with water enriched with dye effluents. Azo dyes dominate the dyeing industry as they represent 50% of the total worldwide production of dye and are known for their photophysical and pharmacological properties.3−5 Photocatalysis has emerged as a beneficial technique for wastewater treatment as compared to other techniques such as ultrafiltration, reverse osmosis, ion exchange, radiation treatment, adsorption, and sedimentation, especially when the wastewater contains toxic organic wastes such as dyes. Conventional methods of water purification may produce novel degradation products for which an additional procedure must be included leading to additional expenditure and a prolonged time for water purification. The use of green alternatives for the degradation of dyes such as nanoparticles from plant sources or any other biomass-derived adsorbent could be potentially exploited to achieve sustainability and help in the conservation of the environment.6 Photocatalysis initiates an advanced oxidation process (AOPs) wherein hydroxyl radicals are produced, which degrade the toxic organic compounds present in wastewater into molecules like H2O, CO2, and some basic salts, which are harmless.7 Heterogeneous photocatalysis in the presence of semiconductors such as iron oxide nanoparticles is a valuable technique because of its sustainability and reusability. Iron oxide nanoparticles (IONPs) have gained much attention in this field as they are easy to synthesize, economical, and eco-friendly, and much to the added advantage, they can easily be separated from the sample by a simple application of a magnetic field without the hassle of inculcating separation techniques such as charge separation, centrifugation, and sedimentation. Green synthesis of IONPs has been reported using extracts of Ficus carica (common fig),8Eichhornia crassipes,9Ruellia tuberosa,10 and Eucalyptus Globulus,11 and the spectrum of their application includes their use as drug-delivery agents,12 as contrasting and imaging agents,13 in thermal ablation, and as hyperthermia agents,14 biosensors,15 fertilizers,16 pesticides,17 gene therapy agents,18 cell proliferation agents,19 etc.
In the present work, we have focused on the degradation ability of IONPs synthesized using Hylocereus undatus (H. undatus) toward two azo dyes, namely, metanil yellow and orange II. Metanil yellow (CAS no. 587-98-4), also referred to as acid yellow 36, is an azo dye. It is an unpermitted food dye and is commonly used as an adulterant for obtaining a yellow color in turmeric and yellow lentils, especially in some parts of India.20 The results of metanil yellow in animal studies have labeled it as a neurotoxin as well as hepatotoxic, making it a potent water pollutant from discharges of soap, tannery, textile, and polishes.21 Orange II (CAS no. 633-96-5), also known as acid orange 7, is a direct dye used for dyeing cotton, nylon textiles, and wool.22 Orange II is known to be carcinogenic and also affects the eyes, mucous membranes, and upper respiratory tract.23 It is also known to increase biological oxygen demand by preventing oxygen and light penetration into water bodies, affecting marine life.24 Therefore, both of these dyes are known to harm humans and may have prolonged effects and should essentially be removed from the wastewater before being discharged into water bodies. The structure of metanil yellow and orange II is represented in Figure 1. The wavelengths for maximum absorption (λmax) of metanil yellow and orange II are 434 and 486 nm, respectively.
Figure 1.

Molecular structure of (A) metanil yellow dye and (B) orange II dye.
The two basic aspects presented over here are, first, the basic operating conditions required for the elimination of dye and, second, the determination of reactive sites for understanding the mechanism of degradation of these dyes. For the former objective, various parameters such as photocatalyst concentrations, pH conditions, and initial dye concentrations were varied to obtain the most suitable conditions for the degradation to occur. For the latter objective, a computational study was performed to reveal the parameters that could help us to decipher the important information related to the active sites of the dye. Computational insight was inculcated in the work with the help of density functional theory (DFT), which is an important tool to investigate the electronic structure of any compound and also gives important insights into the geometrical parameters and bonding. DFT has extended the interpretation and prediction regarding the complex behavior of multi-electronic systems. DFT has been used to obtain the optimized geometry of the multi-electronic structure of the two azo dyes under study. Thermodynamic properties such as the free energy, dipole moment, chemical hardness, softness, and electrophilicity index have also been calculated in DFT. HOMO (highest occupied molecular orbital) and LUMO (lowest unoccupied molecular orbital) gaps were also calculated to correlate the theoretical data with the experimental data. The molecular orbitals of the two dyes were also sketched to better understand the electronic transitions.
2. Materials and Methods
Ferrous sulfate heptahydrate (FeSO4·7H2O), ferric sulfate hydrate (FeSO4·H2O), ammonium hydroxide (NH4OH, 99.9%), ethanol, NaOH (purity of >97%), and HCl (purity ≈ 70%) were procured from Sigma-Aldrich, India. Metanil yellow and orange II were purchased from Research Lab Fine Chem Industries, Mumbai. All the materials were used intrinsically without any further purification. The solutions were prepared in double-distilled water. A Gaussian 09 software package was used for DFT calculations with the B3LYP method using a 6-311++G (d, p) basis set. Gauss View 5 software was used for generating the input file and visualization of the results. The pH measurement was carried out with the help of a digital pH meter-alpha 01, which was calibrated with standard buffer solutions of pH 4 and pH 7, and the pH readings were adjusted using 10% NaOH and 10% HCl solutions.
2.1. Preparation of the H. undatus Extract and Synthesis of IONPs
Matured H. undatus fruits (dragon fruit) were collected from the local market of Uttar Pradesh, India, and were then washed and air-dried. Twenty grams of fresh fruit pulp was added to 200 mL of distilled water and boiled for an hour. The prepared extract was kept at 4 °C for further use. FeSO4·7H2O and FeSO4·H2O were mixed in a ratio of 2:1 to distilled water until the salts completely dissolved.25 To this mixture of salts, an equal quantity of the fruit extract was mixed, and the pH was made 11 with the help of NH4OH. A black-brown mixture was obtained, confirming the formation of IONPs. The IONPs were magnetically decanted and washed with alcohol and distilled water several times to remove impurities. Further, IONPs were dried in a hot air oven and stored in an air-tight container until it is required for use.
2.2. Characterization of IONPs Synthesized Using H. undatus
IONPs synthesized using H. undatus were characterized through techniques like PXRD (powder X-ray diffraction), FT-IR (Fourier transform infrared) spectroscopy, UV–Vis (ultraviolet–visible) spectroscopy, and TEM (transmission electron microscopy). FT-IR was recorded on an FT-IR 8400S spectrophotometer from Shimadzu Corporation, Japan. The PXRD pattern was obtained on an X-ray diffractometer (D/teX Ultra 250, Rigaku Corporation, Japan) using Cu Kβ radiation (λ = 1.54439 Å) obtained at 40 kV and 50 mA. A double-beam UV–vis spectrophotometer (UV-1700 series) with a quartz cell of 1 cm path length from Shimadzu Corporation, Japan, was used for procuring absorbance readings wherever required. A Philips CM 10 transmission electron microscope operating at 100 kV was used for procuring TEM micrographs of the prepared nanoparticles.
2.3. Procedure to Study the Photocatalytic Activity of IONPs
To study the photocatalytic activity of prepared iron oxide nanoparticles, two sets of five beakers containing 100 mL of each dye were taken. One beaker of each set was kept without any photocatalyst, that is, zero loading, while in others, the nanoparticles were added so that the concentration of the photocatalyst in each beaker becomes 2, 4, 6, and 8 mg/L. These solutions were kept in sunlight on the roof of our lab premises at Lucknow Christian Degree College, Lucknow, Uttar Pradesh. The absorbance reading of all these solutions was taken hourly from 9 am to 4 pm in August 2021, and the degradation efficiency was calculated for each solution with the help of eq 1.
| 1 |
where Co is the initial concentration and Ct is the concentration at time t of the metanil yellow dye.
The rate constant was calculated using the kinetics graph and the time required for the completion of 25%, 50%, and 75% were calculated from eqs 2–4 as mentioned below:
| 2 |
| 3 |
| 4 |
where T25, T50, and T75 are the time required to complete 25%, 50%, and 75% of the reaction, respectively, and k is the rate constant for the photocatalytic degradation of Metanil yellow dye.
2.4. Computational Study
A computational study of metanil yellow and orange II dye was performed to establish a correlation between the theoretical and experimental data. With the help of DFT, geometry optimization was performed to ensure that the optimized structure was minima in the potential energy surface, and single-point operations were performed on the optimized structure to calculate the dipole moment in the gaseous state, chemical potential, global hardness, electronegativity, dihedral angles, global electrophilicity index, local Fukui indices, oscillator strength, maximum wavelength (λmax), excitation energy (Eexc), etc.
The chemical potential (μ), electronegativity (χ), global hardness (η), global electrophilicity index (ω), ionization potential (I), electron affinity (A), energy of excitation (ΔE), and Fukui indices were calculated with the help of eqs 5–1126−28
| 5 |
| 6 |
| 7 |
| 8 |
| 9 |
| 10 |
| 11 |
where qk(N + 1) is the electronic population of atom k in the anionic molecule and qk(N – 1) is the electronic population of atom k in the cationic molecule.
3. Results and Discussion
3.1. Preparation and Characterization of IONPs Prepared Using H. undatus
The various phytochemicals present in the fruit extract of H. undatus act as reducing as well as stabilizing agents for the synthesis of IONPs. When the iron salts are mixed with the fruit extract, Fe3+ is reduced to Fe0 and the phytochemicals react with the salts of iron to give IONPs. The FT-IR analysis of prepared IONPs (Figure 2) confirmed the preparation of IONPs and also the presence of various functional groups present at the surface of these nanoparticles on account of their green synthesis. The peak at position 3184.31 cm–1 signifies the −OH bond of the carboxylic acid present in the fruit extract. The peaks at 2159.82 and 2033.37 cm–1 are due to the stretching vibrations of −C≡C–. Again, peak at 1607.52 cm−1 represents the stretching vibration of −C=C–. The peaks at 1423.74, 1068.77, and 980.14 cm–1 are attributed to −C–C–, −C–O, and −C–H bonds of the phytochemicals present at the IONP surface. Also, the Fe–O bond stretch at 474.49 cm–1 confirms the presence of iron oxide nanoparticles. The TEM micrograph (Figure 3) shows that the synthesized nanoparticles are approximately 10 nm in size and the phytochemicals present on the surface of IONPs form a layer around them indicating that they play an important role in the formation of IONPs. The cluster of nanoparticles is due to the presence of water used as a solvent during its preparation. The UV spectra of IONPs (Figure 4) show a major absorption peak between 250–298 cm–1 because of Fe–O bonds present in IONPs. The XRD pattern (Figure 5) obtained from IONPs reveals 2θ = 35.679 as the highest intensity peak, which corresponds to the α-Fe2O3 phase of nanoparticles, and the average crystallite size was calculated to be around 10 nm (approximately), which is consistent with TEM results. The major lattice planes present in IONPs were (104), (110), (202), (116), (122), and (214), which were consistent with the diffraction angles of 33.15°, 35.67°, 43.32°, 53.88°, 57.45°, and 62.89°. The crystal structure of IONPs was rhombohedral. The crystalline nature of the IONPs is depicted through sharp and intense peaks in the XRD pattern.
Figure 2.

FT-IR spectra of IONP synthesized using H. undatus.
Figure 3.

TEM micrographs of IONPs synthesized using H. undatus. (a) High-magnification image. (b) Low-magnification image.
Figure 4.

UV–vis spectra of IONPs synthesized using H. undatus.
Figure 5.

XRD spectra of prepared IONPs with corresponding lattice planes.
3.2. Degradation Study of Metanil Yellow and Orange II Dye
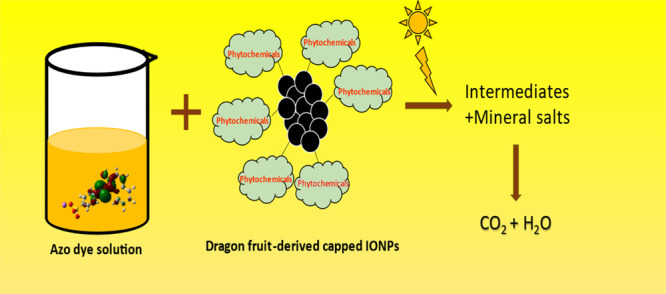
IONPs are responsible for AOPs in which hydroxyl radicals are produced to be responsible for the degradation of metanil yellow. Electron–hole pairs are produced in a suspension containing IONPs when exposed to sunlight.27 The oxygen of the environment is converted into superoxide radicals that subsequently convert into hydroxyl radicals. Similarly, holes convert water into hydroxyl radicals. These hydroxyl radicals consequently cause oxidative degradation of metanil yellow converting it into products such as CO2, H2O, H2, O2, etc., which are harmless.28 In addition to hydroxyl radicals produced, the phytochemicals present at the surface of IONPs due to their synthesis from H. undatus also play a vital role in the degradation of metanil yellow. The degradation of metanil yellow and orange II can be figuratively represented by Figure 6a, while Figure 6b shows the before- and after-degradation pictures of metanil yellow using IONPs synthesized using H. undatus.
Figure 6.

(a) Summary of the probable mechanism of degradation of metanil yellow and orange II. (b) Before- and after-degradation images of the vial containing metanil yellow and orange II. (Photograph courtesy of Mehar Rizvi. Copyright 2022.)
Metanil yellow and orange II were used as model dyes to study the photocatalytic ability of synthesized iron oxide nanoparticles using H. undatus. The beakers with zero loading and 2, 4, 6, and 8 mg/L photocatalyst were stirred in the dark for approximately 30 min after adding the photocatalyst to reach equilibrium and then kept in the sunlight. The analysis was performed hourly for a 7 h span, and their absorbance reading was noted. If required, the sample was kept in the dark, and resumed the experiment the next day to complete the observation time of 7 h. The solutions were already tested in the dark for any change in the absorbance reading, which came out to be negative. The influence of the pH of the solution, different photocatalyst concentrations, and the initial concentration of the dye was observed, and the observations were compiled.
3.2.1. Effect of the Photocatalyst Loading and Its Contact Time with the Two Azo Dyes
Two sets of experiments for each dye (metanil yellow and orange II) were directed for observing the effect of the photocatalyst loading in which the initial dye concentration was kept at 20 ppm, and those with photocatalyst concentrations of 2,4, 6, and 8 mg/L and zero loading were kept in sunlight. The experiments were performed at the natural pH of each dye. The absorbance readings obtained for the two dyes are combined in Table 1, depicting the change in the absorbance reading when the photocatalyst concentration is changed from 0 to 8 mg/L. It can be observed from the absorbance reading that, as the concentration of the photocatalyst was increased sequentially from 2 to 8 mg/L, the absorbance of each dye decreases significantly. It is also observed the degradation percentage rose from 18% to 95% in 7 h when the catalyst loading is 8 mg/L, whereas the degradation percentage rose from 9% to 58% in 7 h when the catalyst loading is 2 mg/L for metanil yellow dye. Correspondingly, for orange II dye, the degradation percentage rose from 7% to 58% when the catalyst loading was 2 mg/L and 10% to 67% when the catalyst loading was 8 mg/L as seen in Figure 7a,b. Therefore, it is completely evident that the degradation of metanil yellow and orange II increases significantly with the catalyst dose. The total degradation achieved for metanil yellow and orange II when the catalyst loading is 2, 4, 6, and 8 mg/L is shown in Figure 7a,b.
Table 1. Absorbance Readings for Metanil Yellow and Orange II Dye Solution when the Photocatalyst Concentration Is Changed from Zero Loading to 2, 4, 6, and 8 mg/L.

Figure 7.

(a) Degradation efficiency of (i) metanil yellow and (ii) orange II dye at different intervals of time-varying catalyst doses. (b) Total degradation achieved for different catalyst loadings for (i) metanil yellow and (ii) orange II dye.
3.2.2. Kinetics of Degradation
The kinetic rate constant for the pseudo-first-order reaction rate was calculated using the eq 12
| 12 |
where Co is the initial concentration of the dye, C1 is the final concentration of the dye in parts per million, t is the time of the reaction, and k1 (h–1) is the rate constant for the first-order reaction.
The rate constants for pseudo first-order degradation of metanil yellow and orange II were calculated by plotting the right-hand side eq 12 and time t in Figure 8a,b, respectively. The photocatalytic degradation of metanil yellow and orange II by IONPs synthesized using H. undatus fits perfectly into the kinetics of a first-order reaction as the R2 values for pseudo first-order kinetics were greater than those calculated for other orders. The data of calculated rate constants and T25, T50, and T75 is summarized in Table 2. For the metanil yellow dye, the rate constant increases by 40% when the catalyst concentration changes from 2 to 4 mg/L, 49% when the catalyst concentration changes from 4 to 6 mg/L, and 83% when the catalyst concentration changes from 6 to 8 mg/L, and it is also evident that it takes only 1.25 h to complete half of the reaction when the concentration of the photocatalyst is 8 mg/L whereas 4.97, 3.56, and 2.39 h is required to reach half of the initial concentrations of the dye when the photocatalyst concentration is 2, 4, and 6 mg/L, respectively. For the orange II dye, the rate constant increases by 49% when the catalyst concentration changes from 2 to 4 mg/L, 52% when the catalyst concentration changes from 4 to 6 mg/L, and 84% when the catalyst concentration changes from 6 to 8 mg/L. Also, 4.96,3.32, 2.27, and 1.23 h are required in each case to reach half of the initial concentration of the dye when the photocatalyst concentration is 2, 4, 6, and 8 mg/L respectively.
Figure 8.

Plot for pseudo first-order kinetics for degradation of (a) metanil yellow and (b) orange II by IONPs synthesized using H. undatus and the R2 squared values.
Table 2. Evaluation of the Rate Constant for Pseudo First-Order Degradation of Metanil Yellow and Orange II by IONPs Synthesized Using H. undatus and Comparison of Times Required to Complete 25%, 50%, and 75% of the Reaction for Different Concentrations of IONPs.
| catalyst loading | parameters | metanil yellow dye | orange II dye |
|---|---|---|---|
| zero loading | first-order rate constant (k) (h–1) | 0.0005 ± 0.00000 | 0.0004 ± 0.00000 |
| T25 (h) | -- | -- | |
| T50 (h) | -- | -- | |
| T75 (h) | -- | -- | |
| 2 mg/L | first-order rate constant (k) (h–1) | 0.1392 ± 0.0106 | 0.1396 ± 0.0062 |
| T25 (h) | 2.06 | 2.06 | |
| T50 (h) | 4.97 | 4.96 | |
| T75 (h) | 9.95 | 9.92 | |
| 4 mg/L | first-order rate constant (k) (h–1) | 0.1941 ± 0.0167 | 0.2083 ± 0.0050 |
| T25 (h) | 1.47 | 1.38 | |
| T50 (h) | 3.56 | 3.32 | |
| T75 (h) | 7.13 | 6.65 | |
| 6 mg/L | first-order rate constant (k) (h–1) | 0.2894 ± 0.0115 | 0.3049 ± 0.0064 |
| T25 (h) | 0.99 | 0.94 | |
| T50 (h) | 2.39 | 2.27 | |
| T75 (h) | 4.78 | 4.54 | |
| 8 mg/L | first-order rate constant (k) (h–1) | 0.5362 ± 0.0051 | 0.5632 ± 0.0157 |
| T25 (h) | 0.53 | 0.51 | |
| T50 (h) | 1.29 | 1.23 | |
| T75 (h) | 2.58 | 2.46 |
3.2.3. Effect of Initial Dye Concentrations on Degradation Efficiency of IONPs
To assess the effect of initial concentrations of metanil yellow and orange II on the degradation efficiency of IONPs, a series of experiments were performed with initial dye concentrations of 20, 40, 60, and 80 ppm with a catalyst loading of 2 mg/L and standard pH of 3. The degradation efficiency in each case for the respective dye was plotted to obtain Figure 9a,b. In the case of metanil yellow degradation, it can be seen that 20 ppm reached almost 99% degradation within 9 h, while 40 ppm took slightly more than 11 h. Similarly, 60 and 80 ppm took 13 and 16 h, respectively. Likewise, the 20 ppm solution of orange II dye took around 6 h to reach a 98% degradation rate and that of 40, 60, and 80 ppm took 11, 12, and 13 h, respectively, to reach the maximum degradation percentage. At low concentrations of dye solutions, sunlight penetrates the solution more appropriately to produce higher hydroxyl radicals as a result of AOPs because the dye molecules on the surface of the solution are dispersed on account of the low concentration of the dye. However, as the concentration of dye increases, the dye molecules crowd the surface of the solution, making it denser with a high quantity of dye molecules and fewer IONPs, and because of this, sunlight exposure of IONPs decreases and so does the hydroxyl radical concentration. Hence, 20 ppm was taken as the standard value until otherwise conditions are required.
Figure 9.

Effect of the initial dye concentration on the degradation efficiency of IONPs for (a) metanil yellow dye and (b) orange II dye.
3.2.4. Effect of pH
pH is one of the major factors that affect the process of degradation as it can affect the formation of radicals responsible for the degradation of Metanil yellow and Orange II. We observed the effect of pH by maintaining different pH levels of the dye solution. The pH was controlled with the help of HCl (10%) and NaOH (10%). The pH conditions were maintained before exposure of dye solutions to sunlight and were not controlled during the reaction. Figure 10a,b shows the effect of pH on the degradation of Metanil yellow and Orange II dye with IONPs synthesized using H. undatus. From Figure 10a,b, it can be remarked that degradation is highest for the dye solution with pH 1 followed by pH 4, 8, and 11. Therefore, it can be inferred that the degradation of two dyes using IONPs is favored under acidic conditions as compared to that under basic conditions. Metanil yellow dye solution with pH 1 is degraded almost to 90%, while that with pH 4 experiences 80% degradation. For pH 8 and 11, the degradation efficiency is almost 40% and 35%, respectively. Orange II dye solution with pH 1 is degraded to almost 98%, and those with pH of 3, 8, and 11 are degraded to 75%, 70%, and 65%, respectively. The observations were taken for a period of 7 h and a 20 ppm initial concentration and 2 mg/L catalyst loading in each case. Since the degradation of dye directly depends on the production of hydroxyl radicals, the observation can be explained such that a low pH favors the H+ ion concentration, which in turn helps in converting superoxide radicals into hydroxyl radicals. Therefore, the degradation of both the dyes is favorable at low pH values. Also, the pH at zero-point charge (pHzpc) is around 6–7. and at this point, the IONPs tend to agglomerate, decreasing the formation of hydroxyl radicals, justifying the decrease in degradation of metanil yellow dye at higher pH values.
Figure 10.

Effect of pH conditions on degradation of (a) metanil yellow and (b) orange II by IONPs.
4. Computational Study
4.1. Geometry Optimization and Dihedral Angles
To have a better understanding of the electronic structure, molecular structure, and bonds present, the geometry was optimized using density functional theory (DFT) with a B3LYP functional at basis set 6-311G++(d,p). The optimized structure of metanil yellow and orange II dye with the most stable conformation is shown in Figure 11a,b. A detailed analysis of some regions of the two dye molecules was performed, and dihedral angles of the region that were most reactive toward hydroxyl radicals based on the analysis based on the local reactivity indices are presented further in this paper in Figure 12a,b. It can be seen that dihedral angles of metanil yellow dye are greater than those of orange II dye because of the groups attached to the respective dyes. Larger dihedral angles represent a decrease in the planarity, and according to conformational analysis, planarity is inversely proportional to stability. Dye with a greater dihedral angle has lower planarity and is more stable toward radical attacks. Therefore, metanil yellow is less reactive than orange II to a hydroxyl radical attack responsible for the degradation process of dye. Also, the orange II dye can form a tautomer because of the presence of the α-OH group, and as per literature, tautomer-forming dyes are easily dissociable contributing to one of the many reasons behind the greater reactivity of orange II dye.30
Figure 11.

Optimized geometry and atom-numbering of (a) metanil yellow and (b) orange II dye.
Figure 12.

Dihedral angles of most reactive regions in (a) metanil yellow dye and (b) orange II dye.
4.2. Molecular Orbitals and Frontier Molecular Orbital and Electron Transition Analysis
The outermost orbital or highest occupied molecular orbital (HOMO) acts as an electron donor since it has electrons, and the innermost orbital or lowest unoccupied orbital (LUMO) acts as an electron acceptor as it has room for accepting an electron. The frontier molecular orbital is defined by the transition of electrons, which occurs due to interactions between the HOMO and LUMO of reacting species. A higher value of the HOMO indicates the ability of dye or any other compound to donate electrons to appropriate acceptor molecules having a vacant molecular orbital of lower energy. The lower values of LUMO energy indicate the ability of dye or any other compound to accept electrons. The stability and reactivity of any compound can be judged by the energy difference between the HOMO and LUMO. A low difference value refers to the higher electronic transition. The atomic orbital compositions of the molecule orbitals present in a molecule of metanil yellow dye and orange II dye are sketched in Figure 13 representing HOMO–LUMO energy gaps of 2.106 and 4.056 eV, and the detailed analysis of HOMO–LUMO transitions and the band obtained is represented in Table 3. The theoretical data facilitated the identification of a spectral form and positions of bands obtained due to the electronic transitions based on the molecular orbital analysis. The electronic spectra of metanil yellow have a principal band around 455 nm, while its experimental value is 434 nm. This principal band is composed of two transitions, namely, HOMO→LUMO (70%) and HOMO-1 → LUMO (55%), and has an oscillator strength of 1.1510 a.u. which describes the intensity of the band. Correspondingly, the principal band for orange II occurs at 475 nm against an experimental value of 486 nm composed of HOMO→LUMO (69%) and HOMO-1 → LUMO (70%) with an oscillator strength of 0.0103 a.u. and 1.1547 a.u. Another band at 326 nm is obtained that is composed of HOMO-1 → LUMO+2 (61.9%) with an oscillator strength of 0.0953 a.u. It is valuable to note that the theoretical and experimental data have a λmax difference of not more than 25 nm and the spectra obtained are comparable in shapes as seen in Figure 14.
Figure 13.

Molecular orbitals (MOs) of metanil yellow and orange II dye.
Table 3. Calculated Electronic Transitions, Number of Singlet Excited States, Wavelength, Percentage Contribution to Electron Excitation, Oscillator Strength, and Excitation Energy of Metanil Yellow and Orange II Dye.
| no. | electronic transition | % | wavelength (λ) (nm) | oscillator strength (a.u.) | excitation energy (Eexc) (eV) | |
|---|---|---|---|---|---|---|
| metanil yellow | ||||||
| band A | 1A | HOMO → LUMO | 70 | 455 | 1.1510 | 2.31 |
| 2A | HOMO-1 → LUMO | 52 | 425 | 0.0601 | 2.55 | |
| band B | 8A | HOMO → LUMO+2 | 55 | 345 | 0.5477 | 4.19 |
| 10A | HOMO → LUMO+1 | 46 | 322 | 0.0437 | 4.38 | |
| HOMO → LUMO+2 | 36 | 315 | ||||
| 14A | HOMO-1 → LUMO+1 | 52 | 409 | 0.0501 | 4.96 | |
| 20A | HOMO-1 → LUMO+2 | 28 | 337 | 0.0052 | 5.22 | |
| orange II | ||||||
| band A | 2A | HOMO → LUMO | 69.9 | 449 | 0.0103 | 2.25 |
| band B | 3A | HOMO-1 → LUMO | 70 | 475 | 1.1547 | 2.66 |
| band C | 4A | HOMO-2 → LUMO | 67.1 | 411 | 0.0627 | 3.01 |
| band D | 5A | HOMO → LUMO+2 | 61.4 | 360 | 0.0186 | 3.43 |
| 6A | HOMO-2 → LUMO | 68.11 | 345 | 0.0798 | 3.59 | |
| 7A | HOMO → LUMO+1 | 54.5 | 341 | 0.0017 | 3.62 | |
| 9A | HOMO-1 → LUMO+2 | 61.9 | 326 | 0.0953 | 3.79 | |
| band C | 11A | HOMO-1 → HOMO+2 | 25.2 | 309 | 0.0709 | 4.01 |
| 12A | HOMO-1 → HOMO+2 | 50.9 | 306 | 0.0770 | 4.04 | |
| 14A | HOMO → LUMO+2 | 18.8 | 300 | 0.0013 | 4.12 | |
Figure 14.

Comparison of UV–vis graphs obtained experimentally and theoretically for (a) metanil yellow dye and (b) orange II dye.
4.3. Chemical Reactivity Descriptors
DFT was used to obtain the results of chemical hardness, softness, dipole moments of the gaseous phase (μgas), chemical potential (μ), free energy, HOMO and LUMO energies, and HOMO–LUMO energy. These parameters were obtained from calculations performed on molecules of the two dyes presented in Figure 12 and summarized in Table 4. A parameter like chemical hardness (η) is useful in studying the stability and reactivity of a compound. The global electrophilicity index (ω) estimates the stabilizing energy when a surrounding environment provides a chemical entity with an additional electronic charge. The chemical potential (μ) shows the escaping tendency of electrons in compounds. Thermodynamic properties such as Gibb’s free energy play an important role in predicting the spontaneity of a chemical reaction. A more negative value implies improved thermodynamic properties. The ΔE value of metanil yellow is lower than that of orange II dye. The dipole moment of orange II is higher than metanil yellow dye due to the presence of the −OH group. The free energy of metanil yellow is −1645.055 Hartree, and that of orange II is −1580.2352 Hartree, suggesting metanil yellow is more stable than orange II dye. The chemical potential of the two dyes is higher than that of the hydroxyl radical, which infers that the dyes are electron donors while the hydroxyl radical acts as an electron acceptor and the dye is therefore susceptible to radical attacks. Also, the chemical potential of metanil yellow is −6.873, which is smaller than that of orange II dye, which is −5.5103, predicting a greater electron escaping tendency of orange II. The larger values of parameters λmax, f, and Eexc for metanil yellow than orange II indicate higher stability and less reactivity of the former toward the hydroxyl radical attack. The higher values for orange II dye are ascribed to the presence of the polar −OH group in the compound. Thus, the investigation of theoretical parameters points toward the higher reactivity of Orange II. Also, these results are coherent with the experimental results pointing to greater reactivity of orange II. However, the experimental results for the degradation of metanil yellow and orange II do not vary much from each other as can be seen from Table 2. This discrepancy between experimental and theoretical results can be explained on the basis that the reactivity of the dye for the degradation process is dependent on the hydroxyl radical attack on the azo bonds, breaking it further into simpler products, and these simpler products occupy the free surface of the catalyst, lowering its reactivity and production of hydroxyl radicals as the sunlight penetration is reduced because of the increase in the number of byproducts.30 When the amount of the photocatalyst is low, no significant difference between the reactivity of metanil yellow and acid orange II is seen experimentally because of the same reason. Though, at a higher photocatalyst concentration, slight visibility in the observed reaction rate is observed as the free sites of the photocatalyst are increased but, at the same time, byproduct levels of the degradation reaction also increase, leading to the saturation of free sites. This explains the difference between the observed and predicted reactivity through DFT calculations as the latter considers only the structural parameters of the dye and the possibility of its reactivity toward a particular reaction but not the parameters that change during the reaction, which could retard the rate of reaction.
Table 4. Calculated Free Energy (Hartree), Dipole Moment in Gaseous Phase (μgas) (Debye), Chemical Potential (μ), Global Hardness (η), Softness (δ), Global Electrophilicity Index (ω), Ionization Potential (IP), Electron Affinity (EA) (in eV), Maximum Wavelength (λmax) (Nm), Oscillator Strength (f), Excitation Energy at Maximum Wavelength (Eexc) of Metanil Yellow Dye and Orange II Dye, and Comparison with Hydroxyl Radical Values.
| parameters | values for metanil yellow | values for orange II | values for OH radical |
|---|---|---|---|
| free energy | –1545.055 | –1580.2352 | –75.42 |
| μgas | 7.599 | 8.7582 | 1.660 |
| HOMO | –7.836 | –7.7636 | –9.74 |
| LUMO | –5.730 | –3.2570 | –5.06 |
| ΔE | 2.106 | 4.5066 | 4.68 |
| Η | 1.053 | 2.2533 | 2.71 |
| Μ | –6.783 | –5.5103 | –4.53 |
| Δ | 0.949 | 0.443 | 0.369 |
| Ω | 21.846 | 5.9935 | 5.87 |
| IP | 7.836 | 7.7636 | 13.01 |
| EA | 5.730 | 3.2570 | 1.830 |
| λmax | 455 | 475 | -- |
| f | 1.1510 | 1.1547 | -- |
| Eexc | 2.31 | 2.25 | -- |
4.4. Molecular Electrostatic Potential (MESP)
The molecular electrostatic potential (MESP) depicts the electronic density and manifests the most probable region for electrophilic and nucleophilic attacks as well as hydrogen-bonding interactions. The correlation between the total charge distribution and dipole moment, electronegativity, and site of chemical reactivity of a molecule is established by MESP. the MESP map is mapped in Figure 15. The color on the MESP plot indicates the value of the electrostatic potential at the surface. The increasing order of color scheme representing the electrostatic potential is red < yellow < green < light blue < blue. The red color on the MESP surface indicates the electron-rich region and nucleophilic reactivity, whereas blue indicates an electron-deficient region and electrophilic reactivity. The intermediate colors in the series are yellow, green, and light blue, representing slightly electron-rich, neutral, and slightly electron-deficient regions respectively.
Figure 15.

Molecular electrostatic potential (MESP) of (a) metanil yellow dye and (b) orange II dye.
4.5. Local Reactivity Indices Analysis
Fukui indices for radical attack (fk0) were calculated for with the help of eq 7. The values were obtained using the B3LYP functional method with a 6-31++G(d,p) basis using water as a solvent in the IEF-PCM model and the results were compiled in the form of Table 5 for metanil yellow and orange II dye. From the data, it was observed that the highest values of fk were obtained for nitrogen atoms in contrast with others. The atoms with the highest fk0 values are most susceptible to radical attacks.29 Therefore, the nitrogen atoms of the two dyes are more susceptible to hydroxyl radical attacks generated by sunlight exposure to IONPs. Orange II has greater values of Fukui indices in the double bond region as compared to metanil yellow. This confirms that orange II dye is more reactive to radical attacks. Also, Fukui index barrier (Δfk) was calculated from eq 13.
| 13 |
Table 5. Calculation of Fukui Indices and the Fukui Index Barrier for Radical Attacks for Metanil Yellow and Orange II Dye.
| metanil
yellow dye |
orange
II dye |
||
|---|---|---|---|
| atoms | fk0 | atoms | fk0 |
| N12 | 0.116384 | 3O | 0.118746 |
| N24 | 0.111033 | 4O | 0.116245 |
| N23 | 0.107001 | 2O | 0.110404 |
| C17 | 0.106425 | 5O | 0.110331 |
| C13 | 0.106320 | 6N | 0.110307 |
| C5 | 0.069596 | 7N | 0.072069 |
| C1 | 0.067264 | 17C | 0.067838 |
| C25 | 0.054037 | 20C | 0.060536 |
| C30 | 0.051825 | 11C | 0.055936 |
| C16 | 0.043719 | 16C | 0.046373 |
| C28 | 0.041114 | 19C | 0.042071 |
| O38 | 0.039485 | 18C | 0.038345 |
| C3 | 0.033900 | 15C | 0.035573 |
| O37 | 0.032696 | 22C | 0.033143 |
| C26 | 0.030904 | 12C | 0.029821 |
| H35 | 0.027660 | 21C | 0.029715 |
| H20 | 0.027496 | 1S | 0.012230 |
| H21 | 0.026825 | 23C | 0.009385 |
| H19 | 0.024088 | 35Na | 0.008977 |
| Na40 | 0.023103 | 13C | –0.095801 |
| H22 | 0.021601 | 14C | –0.098770 |
| H7 | 0.018985 | 9C | –0.128596 |
| H10 | 0.018426 | 34H | –0.130063 |
| H8 | 0.017862 | 33H | –0.137834 |
| S36 | 0.016961 | 24H | –0.141665 |
| H11 | 0.015335 | 26H | –0.143126 |
| H34 | 0.015024 | 27H | –0.143987 |
| H9 | 0.014981 | 28H | –0.147250 |
| H33 | 0.012065 | 8C | –0.148344 |
| H31 | 0.011855 | 29H | –0.149121 |
| H32 | 0.011548 | 32H | –0.157342 |
| C2 | –0.01666 | 10C | –0.160910 |
| C4 | –0.01964 | 30H | –0.161800 |
| C29 | –0.02007 | 25H | –0.162102 |
| C15 | –0.02148 | 31H | –0.165440 |
| C18 | –0.02538 | -- | -- |
| O39 | –0.03013 | -- | -- |
| C6 | –0.03308 | -- | -- |
| C14 | –0.05729 | -- | -- |
| C27 | –0.10279 | -- | -- |
| Fukui index barrier | |||
| Δfko | 0.220215 | Δfko | 0.284186 |
The Fukui index barrier was calculated to gauge the reactivity of two dyes under a hydroxyl radical attack, and we observed that its value is lower for metanil yellow than for orange II dyes. A higher barrier dye is more reactive toward radical attacks as observed experimentally.31 Therefore, we were able to conclude that the degradation mechanism is based on the breaking of azo bonds and is the most reactive region for both dyes.
4.6. Natural Population Analysis
Natural population analysis was performed for the two azo dyes using B3LYP and the 6-311++G(d,p) basis set, and the natural charges for each atom of the two dyes were compiled in Table 6. The natural charges obtained ranged from −1.06118 to 2.26913 e for metanil yellow and −1.14041 to 2.4035 e for orange II dye. From the data in Table 6, it is evident that the maximum negative charge is concentrated over oxygen atoms of the −SO3 group and nitrogen atoms of the azo group. The charges over the carbon atom are distributed according to their positions. The maximum positive charge hovers over the sulfur and sodium atom. The negatively charged oxygen and nitrogen atoms act as electron acceptors as confirmed through Fukui analysis. However, the main active site for hydroxyl radicals is nitrogen atoms of azo dye because of their lower electronegativity. The charges over the hydrogen atoms are zero. Therefore, the Nitrogen atoms of the azo group are the most susceptible site to an attack by a hydroxyl radical.
Table 6. Natural Charges Obtained through Natural Population Analysis of Metanil Yellow and Orange II Dye.
| metanil
yellow |
orange
II |
||
|---|---|---|---|
| atom | charge | atom | charge |
| O37 | –1.06118 | O3 | –1.14041 |
| O38 | –1.06063 | O4 | –1.03882 |
| O39 | –0.91372 | O5 | –1.02181 |
| N12 | –0.60084 | O2 | –0.71563 |
| C1 | –0.24801 | C16 | –0.30914 |
| C26 | –0.24698 | C15 | –0.24507 |
| C3 | –0.2377 | N6 | –0.20783 |
| C5 | –0.23472 | C18 | –0.19677 |
| C17 | –0.23472 | C21 | –0.18977 |
| C13 | –0.2251 | C12 | –0.17492 |
| C15 | –0.20718 | C17 | –0.17164 |
| N24 | –0.20399 | N7 | –0.17077 |
| N23 | –0.20336 | C14 | –0.1578 |
| C25 | –0.19936 | C22 | –0.15566 |
| C27 | –0.19144 | C23 | –0.15149 |
| C28 | –0.18768 | C20 | –0.12325 |
| C4 | –0.18606 | C11 | –0.11523 |
| C6 | –0.1846 | C9 | –0.07125 |
| C18 | –0.17952 | C8 | –0.03896 |
| C30 | –0.16988 | C10 | 0.03982 |
| C29 | 0.10108 | C19 | 0.11479 |
| C14 | 0.11073 | H31 | 0.14931 |
| C2 | 0.16755 | H29 | 0.19578 |
| C16 | 0.16843 | H26 | 0.19614 |
| H8 | 0.20355 | H28 | 0.19653 |
| H11 | 0.20607 | H27 | 0.19693 |
| H9 | 0.20664 | H24 | 0.19935 |
| H10 | 0.20711 | H33 | 0.20965 |
| H22 | 0.20744 | H25 | 0.21435 |
| H20 | 0.21621 | H32 | 0.2231 |
| H7 | 0.21685 | H30 | 0.24157 |
| H21 | 0.21889 | C13 | 0.3879 |
| H34 | 0.22169 | H34 | 0.46904 |
| H19 | 0.22963 | Na35 | 0.95844 |
| H33 | 0.23112 | S1 | 2.4035 |
| H32 | 0.23382 | -- | -- |
| H31 | 0.236 | -- | -- |
| H35 | 0.38712 | -- | -- |
| Na40 | 0.93759 | -- | -- |
| S36 | 2.26913 | -- | -- |
5. Conclusions
IONPs synthesized using H. undatus were approximately 10 nm in size and had an α-phase with a rhombohedral geometry. The major lattice planes present in IONPs were (104), (110), (202), (116), (122), and (214). IONPs proved to be an efficient photocatalyst for the degradation of metanil yellow. The degradation of metanil yellow using IONPs followed pseudo first-order kinetics, and the degradation efficiency increased as the amount of the photocatalyst increased. Also, the degradation efficiency was maximum when the concentration of metanil yellow dye was minimum. A lower pH favors the degradation of metanil yellow. The metanil yellow dye has also been investigated by DFT calculations. Chemical reactivity descriptors such as the chemical potential, free energy, chemical hardness, and electrophilicity index values indicate orange II to be more reactive. Natural population analysis and Fukui indices reveal that the azo group of the two azo dyes were the most reactive sites for the attack of hydroxyl radicals generated by IONPs on exposure to sunlight, leading to the pathway for further degradation of the two dyes. The MESP reveals the electrostatic potential over the two dyes, depicting electron-rich and electron-deficient areas. Electron transition analysis reveals that the theoretical and experimental results correlate, and the UV–vis spectra obtained are comparable in shapes. The higher values of λmax and f correspond to the high reactivity of orange II dye over metanil yellow dye and are attributed to the polar groups present on the former dye. Overall, among the two dyes under observation, better reactivity for orange II was observed and the azo group was the target group for the hydroxyl radical attack. The optimum conditions for the two dyes’ degradation were when the dye concentration was less, the amount of the photocatalyst was high, and the pH was low.
Acknowledgments
The authors are thankful to the Central facility for Computational Research (CFCR), University of Lucknow, for providing access to the computational study, and Lucknow Christian Degree College for all the lab facilities required to carry out the presented work. The authors are also thankful to University Grant Commission for providing a Maulana Azad National Fellowship (MANF) to one of the authors so that the work could be carried out smoothly.
The authors declare no competing financial interest.
References
- Khan S.; Malik A.. Environmental and Health Effects of Textile Industry Wastewater. In Environmental Deterioration and Human Health: Natural and Anthropogenic Determinants; Springer; 2014; 55–71, 10.1007/978-94-007-7890-0. [DOI] [Google Scholar]
- Birhanli A.; Ozmen M. Evaluation of the toxicity and teratogenity of six commercial textile dyes using the frog embryo teratogenesis assay-xenopus. Drug Chem. Toxicol. 2005, 28, 51–65. 10.1081/dct-39689. [DOI] [PubMed] [Google Scholar]
- Ollgaard H.; Frost L.; Gastler J.; Hensen O. C. Survey of Azo-Colorants on Denmark: Milgo Project. Danish Environmental Protection Agency 1999, 509, 166–278. [Google Scholar]
- Qian H. F.; Tao T.; Feng Y. N.; Wang Y. G.; Huang W. Crystal structures, solvatochromisms and DFT computations of three disperse azo dyes having the same azobenzene skeleton. J. Mol. Struct. 2016, 1123, 305–310. 10.1016/j.molstruc.2016.06.042. [DOI] [Google Scholar]
- Şener N.; Bayrakdar A.; Kart H. H.; Şener İ. A Combined Experimental and DFT Investigation of Disazodye Having Pyrazole Skeleton. J. Mol. Struct. 2017, 1129, 222–230. 10.1016/j.molstruc.2016.09.082. [DOI] [Google Scholar]
- Jahan K.; Singh V.; Mehrotra N.; Rathore K.; Verma V. Development of Activated Carbon from KOH Activation of Pre-carbonized Chickpea Peel Residue and Its Performance for Removal of Synthetic Dye from Drinking Water. Biomass Convers. Biorefin. 2021, 10.1007/s13399-021-01938-4. [DOI] [Google Scholar]
- Silva C. G.; Wang W.; Faria J. L. Photocatalytic and Photochemical Degradation of Mono-, Di- and Tri-azo Dyes in Aqueous Solution under UV Irradiation. J. Photochem. Photobiol., A 2006, 181, 314–324. 10.1016/j.jphotochem.2005.12.013. [DOI] [Google Scholar]
- Demirezen D. A.; Yıldız Y. S.; Yılmaz D. D.; Yilmaz S. Green synthesis and characterization of iron oxide nanoparticles using Ficus carica (common fig) dried fruit extract. J. Biosci. Bioeng. 2018, 127, 241–245. 10.1016/j.jbiosc.2018.07.024. [DOI] [PubMed] [Google Scholar]
- Jagathesan G.; Rajiv P. Biosynthesis and characterization of iron oxide nanoparticles using Eichhornia crassipes leaf extract and assessing their antibacterial activity. Biocatal. Agric. Biotechnol. 2018, 13, 90–94. 10.1016/j.bcab.2017.11.014. [DOI] [Google Scholar]
- Vasantharaj S.; Sathiyavimal S.; Senthilkumar P.; Oscar F. L.; Pugazhendhi A. Biosynthesis of iron oxide nanoparticles using leaf extract of Ruellia tuberosa: Antimicrobial properties and their applications in photocatalytic degradation. J. Photochem. Photobiol., B 2019, 192, 74–82. 10.1016/j.jphotobiol.2018.12.025. [DOI] [PubMed] [Google Scholar]
- Balamurugan M.; Saravanan S.; Soga T. Synthesis of Iron Oxide Nanoparticles by Using Eucalyptus Globulus Plant Extract. e-J. Surf. Sci. Nanotechnol. 2014, 12, 363–367. 10.1380/ejssnt.2014.363. [DOI] [Google Scholar]
- Veiseh O.; Gunn J. W.; Zhang M. Design and fabrication of magnetic nanoparticles for targeted drug delivery and imaging. Adv. Drug Delivery Rev. 2010, 62, 284–304. 10.1016/j.addr.2009.11.002. [DOI] [PMC free article] [PubMed] [Google Scholar]
- Modo M.; Bulte J. W. Cellular MR Imaging. Mol. Imaging 2005, 4, 143. 10.1162/15353500200505145. [DOI] [PubMed] [Google Scholar]
- Kita E.; Oda T.; Kayano T.; Sato S.; Minagawa M.; Yanagihara H.; Kishimoto M.; Mitsumata C.; Hashimoto S.; Yamada K.; Ohkohchi N. Ferromagnetic nanoparticles for magnetic hyperthermia and thermoablation therapy. J. Phys. D: Appl. Phys. 2010, 43, 474011. 10.1088/0022-3727/43/47/474011. [DOI] [Google Scholar]
- Perez M.; Josephson L.; Weissleder R. Use of magnetic nanoparticles as nanosensors to probe for molecular interactions. ChemBioChem. 2004, 5, 261. 10.1002/cbic.200300730. [DOI] [PubMed] [Google Scholar]
- Servin A.; Elmer W.; Mukherjee A.; de la Torre-Roche R.; Hamdi H.; White J. C.; Bindraban P.; Dimkpa C. A review of the use of engineered nanomaterials to suppress plant disease and enhance crop yield. J. Nanopart. Res. 2015, 17, 1–21. 10.1007/s11051-015-2907-7. [DOI] [Google Scholar]
- Zhang W. X. Nanoscale iron particles for environmental remediation: an overview. J. Nanopart. Res. 2003, 5, 323–332. 10.1023/A:1025520116015. [DOI] [Google Scholar]
- Dobson J. Gene therapy progress and prospects: magnetic nanoparticle-based gene delivery. Gene Ther. 2006, 13, 283. 10.1038/sj.gt.3302720. [DOI] [PubMed] [Google Scholar]
- Huang D. M.; Hsiao J. K.; Chen Y. C.; Chien L. Y.; Yao M. The promotion of human mesenchymal stem cell proliferation by superparamagnetic iron oxide nanoparticles. Biomaterials 2009, 30, 3645–3651. 10.1016/j.biomaterials.2009.03.032. [DOI] [PubMed] [Google Scholar]
- Nath P. P.; Sarkar K.; Tarafder P.; Mondal M.; Das K.; Paul G. Practice of using Metanil yellow as food colour to process food in unorganized sector of West Bengal. Int. Food Res. J. 2015, 22, 1424–1428. [Google Scholar]
- Nagaraja T. N.; Desiraju T. Effects of chronic consumption of Metanil yellow by developing and adult rats on brain regional levels of noradrenaline, dopamine and serotonin, on acetylcholine esterase activity and on operant conditioning. Food Chem. Toxicol. 1993, 31, 41–44. 10.1016/0278-6915(93)90177-z. [DOI] [PubMed] [Google Scholar]
- Hunger K.; Mischke P.; Rieper W.; Raue R.; Kunde K.; Engel A.. Azo Dyes. Ullmann’s Encyclopedia of Industrial Chemistry; Wiley-VCH Press, 2005, 10.1002/14356007.a03_245. [DOI] [Google Scholar]
- Gupta V. K.; Mittal A.; Gajbe V.; Mittal J. Removal and recovery of the hazardous azo dye acid orange 7 through adsorption over waste materials: bottom ash and de-oiled soya. Ind. Eng. Chem. Res. 2006, 45, 1446–1453. 10.1021/ie051111f. [DOI] [Google Scholar]
- Ali H. Biodegradation of Synthetic Dyes—A Review. Water, Air, Soil Pollut. 2010, 213, 251–273. 10.1007/s11270-010-0382-4. [DOI] [Google Scholar]
- Rizvi M.; Bhatia T.; Gupta R. Green & Sustainable Synthetic Route of Obtaining Iron Oxide Nanoparticles Using Hylocereus undatus (Pitaya or Dragon Fruit). Mater. Today Proc. 2022, 50, 1100–1106. 10.1016/j.matpr.2021.07.469. [DOI] [Google Scholar]
- Parr R. toto G.; Wang W.. Density Theory for Atoms and Molecules; Oxford University Press, 1989. [Google Scholar]
- Parr R. G.; Szentpály L.; Liu S. Electrophilicity Index. J. Am. Chem. Soc. 1999, 121, 1922–1924. 10.1021/ja983494x. [DOI] [Google Scholar]
- Yang W. T.; Mortier W. J. The Use of Global and Local Molecular Parameters for the Analysis of the Gas-Phase Basicity of Amines. J. Am. Chem. Soc. 1986, 108, 5708–5711. 10.1021/ja00279a008. [DOI] [PubMed] [Google Scholar]
- Ince N. H. Ultrasound-assisted advanced oxidation processes for water decontamination. Ultrason. Sonochem. 2018, 40, 97–103. 10.1016/j.ultsonch.2017.04.009. [DOI] [PubMed] [Google Scholar]
- Haji S.; Khalaf M.; Shukrallah M.; Abdullah J.; Ahmed S. A kinetic comparative study of azo dye decolorization by catalytic wet peroxide oxidation using Fe–Y zeolite/H2O2 and photooxidation using UV/H2O2. React. Kinet., Mech. Catal. 2015, 114, 795–815. 10.1007/s11144-014-0810-3. [DOI] [Google Scholar]
- Elhorri A. M.; Belaid K. D.; Rabah M. Z.; Chadli R. Theoretical study of the azo dyes dissociation by advanced oxidation using Fukui indices. DFT calculations. Comput. Theor. Chem. 2018, 1130, 98–106. 10.1016/j.comptc.2018.03.018. [DOI] [Google Scholar]