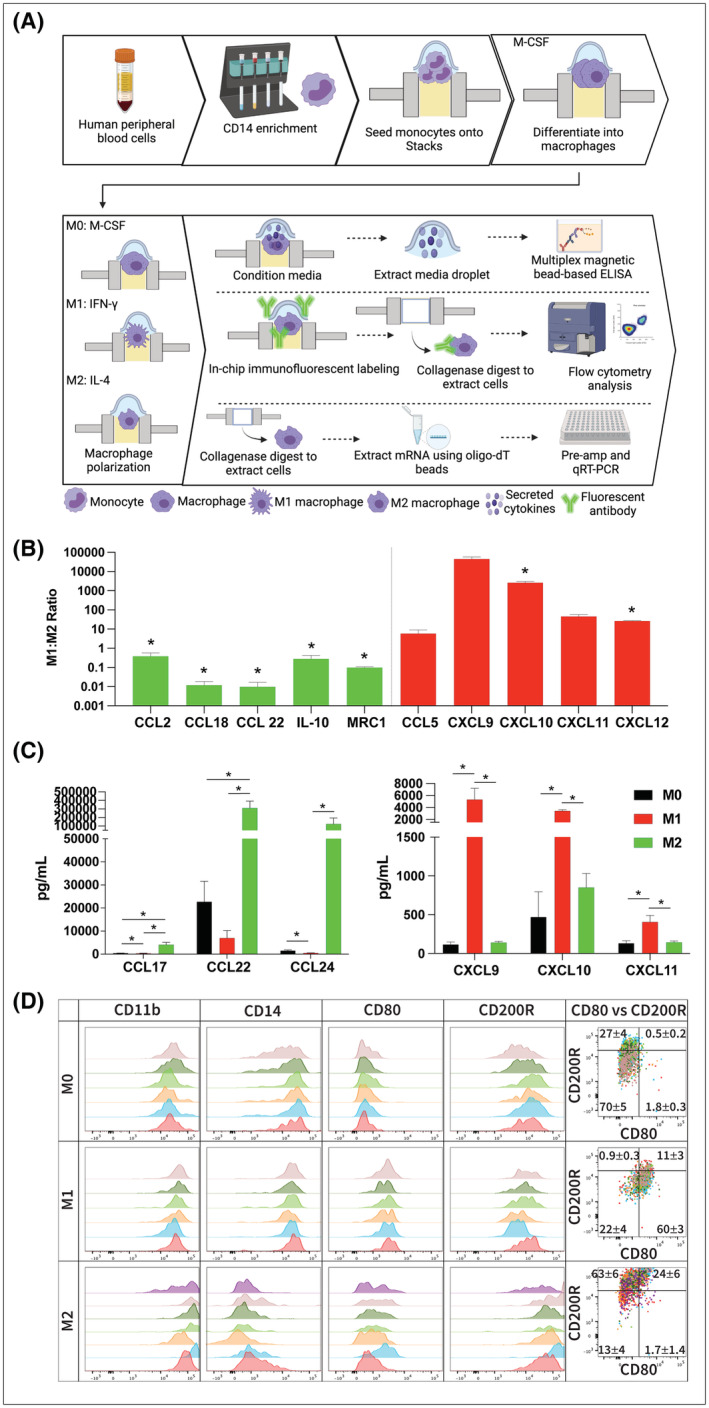
FIGURE 2.

Analysis of gene expression in Stacks. (A) Workflow for isolation, culture, and analysis of gene expression in primary MDMs. (B) mRNA expression of primary MDMs expressed as the M1:M2 ratio (relative expression of each gene in M1 macrophages divided by the relative expression in M2 macrophages). Levels >1 indicates higher expression in M1 macrophages and <1 indicate higher expression in M2 macrophages. Red bars indicate M1‐associated genes and green bars indicate M2‐associated genes (n = 3). (C) Concentration of cytokines in the supernatant media of polarized (M1 and M2) and unpolarized (M0) macrophages as detected by multi‐analyte immunoassay. Left graph is M2‐associated cytokines and right graph is M1‐associated cytokines (n = 3). (D) Flow cytometry analysis of polarized (M1 and M2) and unpolarized (M0) macrophages. Histogram overlays represent CD11b expression on live/single/cells (in first column) and biomarker expression of CD11b+/live/single/cells (in second, third, fourth histogram columns and in dot plots). Individual colors represent individual samples. Data in dot plot overlay quadrants represent the frequency of the parent gate as Mean ± SEM for all samples within the group; *p < .05.
