FIGURE 4.

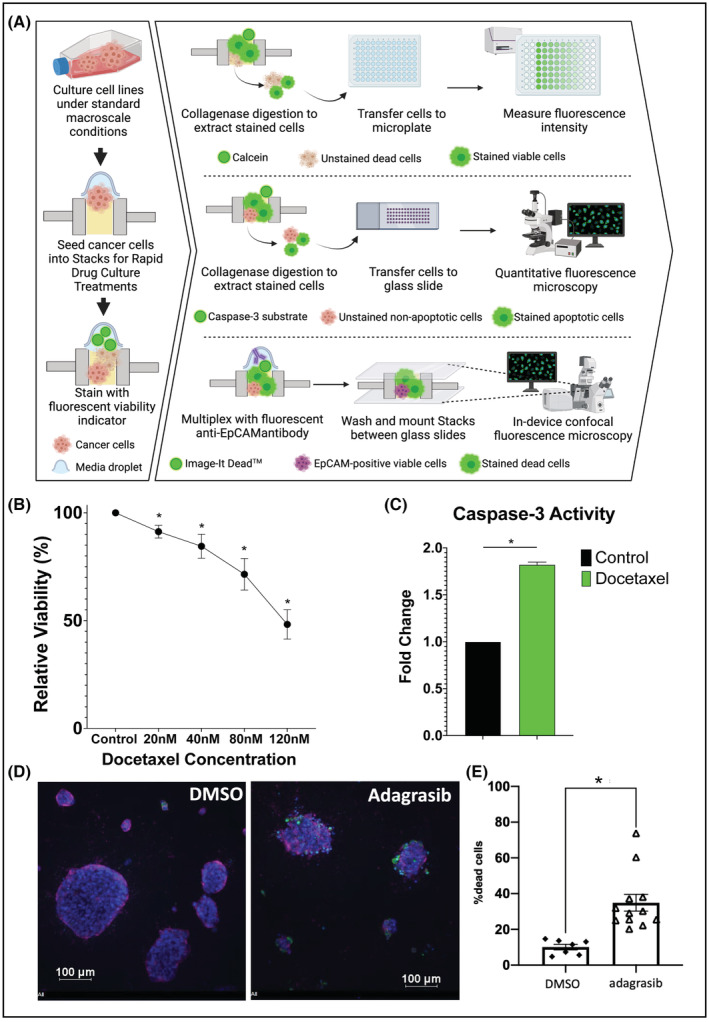
Cytotoxicity assays on cell lines in Stacks. (A) Workflow for cytotoxicity assays on cell lines. (B) Dose titration curve of 22rv1 prostate cancer cells treated with docetaxel for 48 h followed by analysis of viable cell number using quantification of Calcein AM staining with a microplate reader. Data expressed as percent of viable cells as compared to control condition (n = 3). (C) Quantification of caspase‐3 activity in DU145 prostate cancer cells treated with 20 nM docetaxel for 48 h. Data expressed as fold change of caspase‐3 activity in docetaxel treated cells as compared to control condition (n = 3). (D) The H358 lung cancer cell line expressing the KRAS G12C oncogene was cultured in Stacks and treated with vehicle or a KRAS G12C inhibitor (n = 2). Cells were stained with Hoechst (blue), anti‐EpCAM‐Alexa647 antibody (purple) and Image‐IT Dead™ reagent (green), and imaged in‐device using confocal fluorescence microscopy. (E) Dead cells and total number of cells was quantified with automated image analysis and the percentage of dead cells was significantly induced by inhibition of KRAS G12C in H358 lung cancer cells. Each data point represents percentage of Image‐IT Dead™‐positive cells in one microwell; *p < .05.
