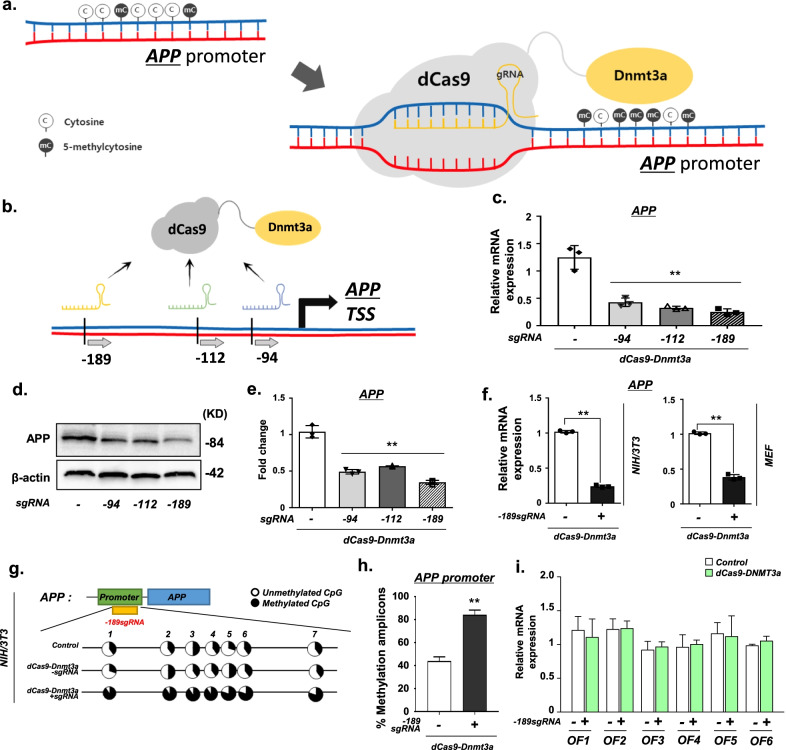
Fig. 1.
dCas9-Dnmt3a mediated APP methylation in vitro. (a) Schematic of the dCas9-Dnmt3a-mediated APP methylation system. b Schematic of the location of the APP promotor-targeting single guide RNAs (sgRNAs) for APP allele methylation. c Quantitative real-time PCR analysis of APP mRNA expression with sgRNAs targeting different locations, − 94, − 112, and − 189 bp from the APP start codon. Data are expressed as mean ± SEM (n = 3). **P < 0.01, one-way ANOVA with Tukey’s post-hoc test. d, e Western blot analysis of APP N-terminal in NIH/3T3 cells treated with different sgRNAs (− 94, − 112, or − 189 sgRNA). Data are expressed as mean ± SEM (n = 3). **P < 0.01, one-way ANOVA with Tukey’s post-hoc test. f Quantitative real-time PCR analysis of APP expression in NIH/3T3 cells and MEF cells treated with − 189 sgRNA. Data are expressed as mean ± SEM (n = 3). **P < 0.01, two-sided Student’s t-test. g Bisulfite sequencing analysis of the promoter region of APP in NIH/3T3 cells treated with − 189 sgRNA and dCas9-Dnmt3a. h Quantification of methylated amplicons. In 3 independent experiments, 10 to 30 sequencing data were measured in total. Data are expressed as mean ± SEM. **P < 0.01, two-sided Student’s t-test. i Quantitative real-time PCR analysis of the predicted off-target genes in NIH/3T3 cells treated with − 189 sgRNA and dCas9-Dnmt3a. Data are expressed as mean ± SEM (n = 3). *P < 0.05, two-sided Student’s t-test. The image in d is representative of three or more similar experiments

