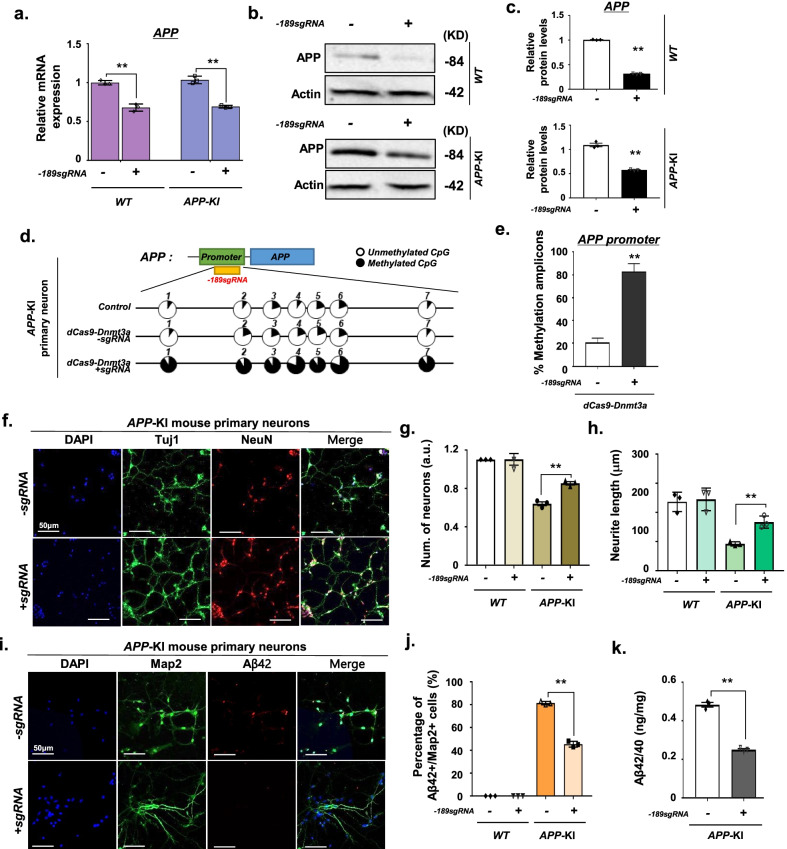
Fig. 2.
dCas9-Dnmt3a-mediated APP methylation enhanced neuroprotection in APP-KI mouse primary neurons. a Quantitative real-time PCR analysis of APP expression in WT and APP-KI mouse primary neurons treated with − 189 sgRNA and dCas9-Dnmt3a. Data are expressed as mean ± SEM (n = 3). **P < 0.01, two-sided Student’s t-test. b, c Western blot analysis of APP in WT and APP-KI mouse primary neurons treated with − 189 sgRNA and dCas9-Dnmt3a. Data are expressed as mean ± SEM (n = 3). **P < 0.01, two-sided Student’s t-test. d Bisulfite sequencing analysis of the promoter region of APP in APP-KI mouse primary neurons treated with − 189 sgRNA and dCas9-Dnmt3a. e Quantification of methylated amplicons. In 3 independent experiments, 10 to 30 sequencing data were measured in total. Data are expressed as mean ± SEM. **P < 0.01, two-sided Student’s t-test. f Immunostaining of Tuj1 (green), NeuN (red), and DAPI (blue) in APP-KI mouse primary neurons treated with − 189 sgRNA and dCas9-Dnmt3a. g The number of Tuj1-positive neurons in f. Data are expressed as mean ± SEM (n = 3). **P < 0.01, two-sided Student’s t-test. h Quantification of neurite length. In 3 independent experiments, over 100 neurites were measured. Data are expressed as mean ± SEM (n = 3). **P < 0.01, two-sided Student’s t-test. i Map2 (green), Aβ42 (red), and DAPI (blue) immunostaining in APP-KI mouse primary neurons treated with − 189 sgRNA and dCas9-Dnmt3a. j Percentage of Aβ42+/Map2+ cells from i. In 3 independent experiments, over 100 neurites were measured. Data are expressed as mean ± SEM (n = 3). **P < 0.01, two-sided Student’s t-test. k ELISA of the Aβ42/40 protein ratio in APP-KI mouse primary neurons transduced with − 189 sgRNA and dCas9-Dnmt3a. Data are expressed as mean ± SEM (n = 3). **P < 0.01, two-sided Student’s t-test. The images in b, f, i are representative of three or more similar experiments

