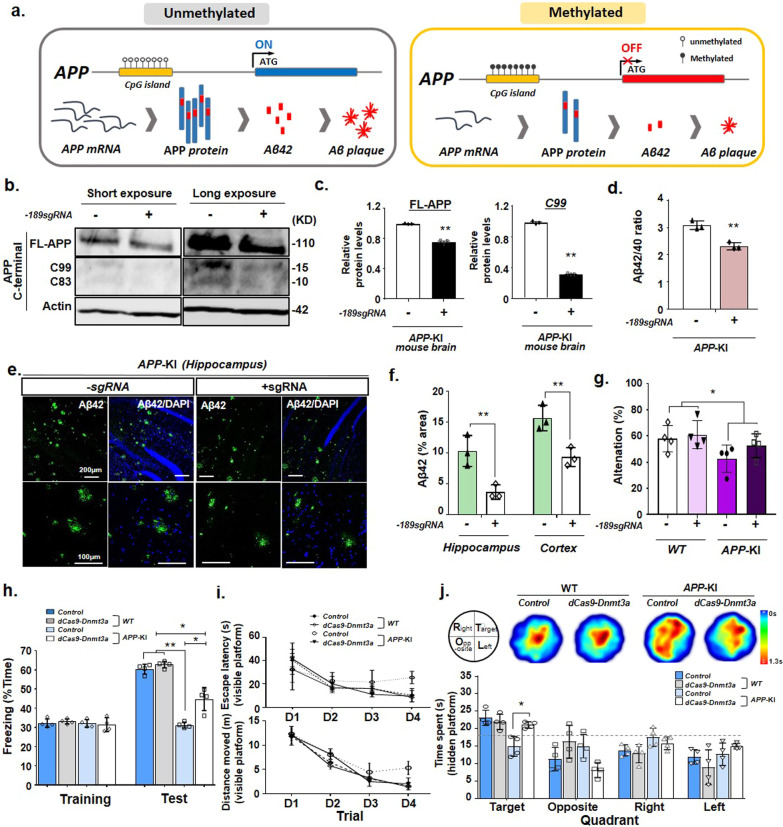
Fig. 4.
dCas9-Dnmt3a-mediated DNA methylation elicited therapeutic effects on the APP-KI mouse model. a Schematic of a DNA methylation editing-based strategy for the APP-KI mouse model. b, c Western blot analysis and quantification of full-length APP (FL-APP), β-secretase-derived C-terminal fragment (CTF) (C99), γ-secretase-derived CTF (C93), and beta-actin (Actin) in the APP-KI mouse hippocampus infected with − 189 sgRNA and dCas9-Dnmt3a. Data are expressed as mean ± SEM (n = 3). **P < 0.01, two-sided Student’s t-test. d ELISA analysis of the Aβ42/40 ratio in the APP-KI mouse hippocampus transduced with − 189 sgRNA and dCas9-Dnmt3a. Data are expressed as mean ± SEM (n = 3). **P < 0.01, two-sided Student’s t-test. e Aβ42 (green) and DAPI (blue) immunostaining in the APP-KI mouse hippocampus transduced with − 189 sgRNA and dCas9-Dnmt3a. f Quantification of the Aβ42 area presented in e. Data are expressed as mean ± SEM (n = 3). **P < 0.01, two-sided Student’s t-test. g Y-maze spontaneous alternation of WT and APP-KI mice transduced with − 189 sgRNA and dCas9-Dnmt3a. *P < 0.05; P > 0.05 APP-KI vs APP-KI+ −189 dCas9-Dnmt3a group, one-way ANOVA with Tukey’s post-hoc test. h Percentage of freezing behavior during the contextual fear memory test. Data are expressed as mean ± SEM. *P < 0.05, **P < 0.01, one-way ANOVA with Tukey’s post-hoc test. i, j Morris water maze test for evaluation of long-term spatial memory. i Escape latency (upper) and total distance moved (lower) during the visible platform training session. Data are expressed as mean ± SEM. *P < 0.05, one-way ANOVA with Tukey’s post-hoc test. j Heatmap and quantification represent the quadrant occupancy time during the hidden platform test session. Data are expressed as mean ± SEM. *P < 0.05, one-way ANOVA with Tukey’s post-hoc test. The images in b, e are representative of three or more similar experiments

