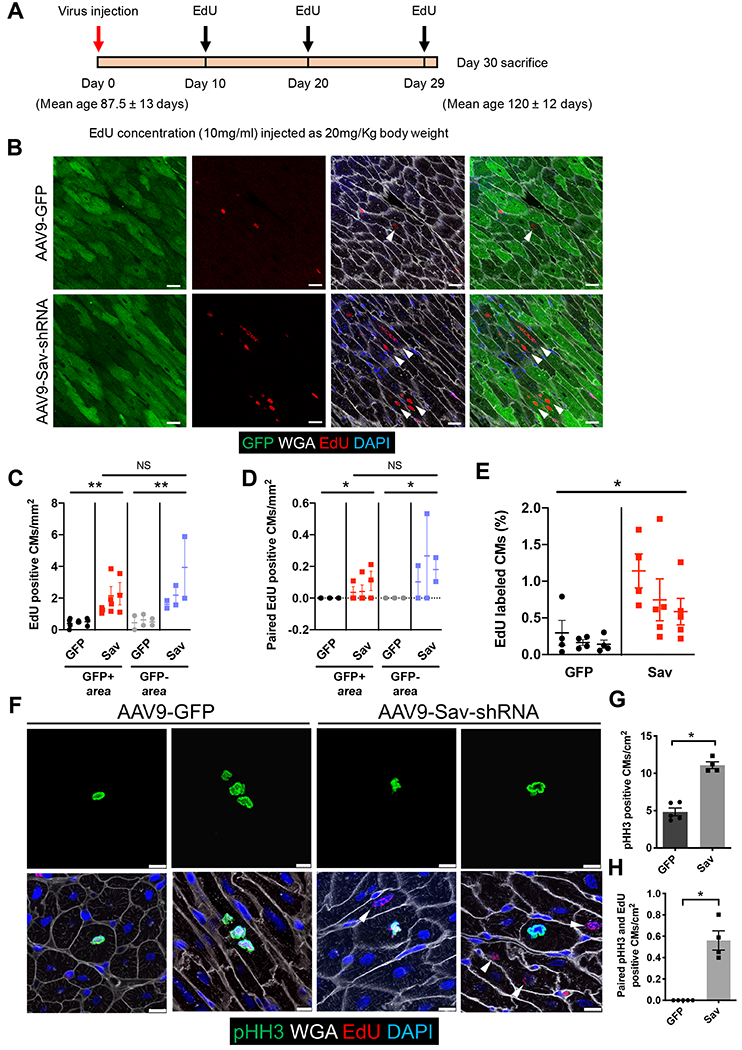
Fig. 2. Increased cardiomyocyte proliferation in uninjured pig hearts injected with AAV9-Sav-shRNA.

(A) Schematic shows the timing of viral vector and EdU injections. (B) Shown are representative images of immunofluorescence staining for GFP and EdU in the hearts of uninjured pigs (P-1890, AAV9-GFP control; P-1891, AAV9-Sav-shRNA). Both pigs were euthanized at the age of 120 days, 31 days after viral vector injection. White arrowheads indicate EdU-positive cardiomyocytes. Scale bars, 25 μm. (C and D) Shown is quantification of EdU-positive cardiomyocytes (C) and paired EdU-positive cardiomyocytes (D). Each dot represents one tiled image (n = 3 per group). One-way ANOVA with Tukey’s post hoc test was used for comparisons shown in (C); a nested t test was used for (D). (E) Machine learning quantification of EdU-positive cardiomyocytes is shown (n = 3). Four to five tiled images were analyzed per pig heart. A nested t test was used for the comparison. (F) Representative images show immunofluorescence staining for pHH3 and EdU in pig hearts (P-1900, AAV9-GFP control; P1902, AAV9-Sav-shRNA). White arrowheads indicate EdU-positive cardiomyocytes near pHH3-positive cardiomyocytes. Scale bars, 10 μm. (G) Shown is quantification of the number of pHH3-positive cardiomyocytes: GFP control, 4.84 ± 0.524 cardiomyocytes per cm2; AAV9-Sav-shRNA (Sav) 11.10 ± 0.460 cardiomyocytes per cm2 (GFP, n = 5; Sav, n = 4). (H) Shown is quantification of the number of paired pHH3-positive and EdU-positive cardiomyocytes, that is, the number of pHH3-positive cardiomyocytes with adjacent EdU-positive cardiomyocytes (GFP control, n = 5; Sav, n = 4). The Mann-Whitney test was used for comparisons for (G) and (H). Data are presented as the means ± SEM. For all comparisons, *P < 0.05, **P < 0.01.
