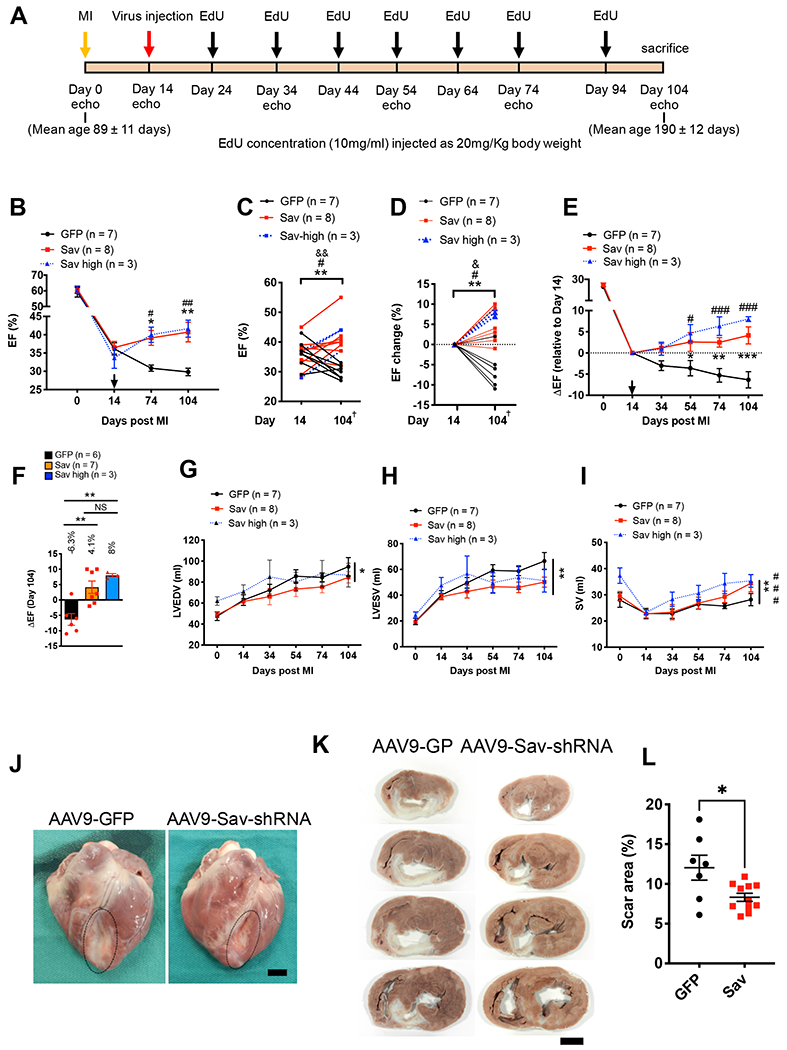
Fig. 3. Improved heart function in pigs with myocardial infarction after AAV9-Sav-shRNA gene therapy.

(A) Schematic shows the timing of viral vector injection, EdU injections, and echocardiography (echo) studies in a pig model of I/R-induced myocardial infarction (MI). (B to D) Echocardiography results show the ejection fraction (EF) after myocardial infarction (B), the ejection fraction at day 14 to 104 after myocardial infarction (C), and the change in ejection fraction from days 14 to 104 after myocardial infarction (D); Two-tailed paired t test was used in (C), and two-way ANOVA with Bonferroni post hoc test was used in (D). *, #, and & indicate comparison between days 14 and 104 after myocardial infarction for AAV9-GFP control (GFP) pig heart and low- (Sav) and high-dose (Sav high) pig hearts injected with AAV9-Sav-shRNA respectively. * and &P < 0.05, **, ##, and &&P < 0.01; # = 0.07 in C, # = 0.0339 in D. arrow indicates virus injection in B; + indicates one pig treated with AAV9-GFP and one pig treated with low dose AAV9-Sav-shRNA that were both euthanized at day 74 post myocardial infarction. (E and F) Longitudinal plot of changes in EF associated with day 14 after myocardial infarction for AAV9-GFP control and low-dose (Sav) and high-dose (Sav high) AAV9-Sav-shRNA (E). Bar graph with individual data points shows changes in ejection fraction on day 104 relative to day 14 after myocardial infarction (F). (G to I) Shown are left ventricular end-diastolic volume (LVEDV) (G), left ventricular end-systolic volume (LVESV) (H), and stroke volume (SV) (I) for pigs treated with AAV9-GFP as control (n = 7), low-dose AAV9-Sav-shRNA (Sav; n = 8), or high-dose AAV9-Sav-shRNA (Sav high; n = 3) gene therapy. Two-way ANOVA with Bonferroni’s post hoc test was used for comparisons in (B), (E), (G), (H), and (I); one-way ANOVA with Tukey’s post hoc test was used for panel (F); Asterisk indicates comparison between AAV9-GFP (GFP) control and AAV9-Sav-shRNA low dose (Sav); # indicates the comparison between AAV9-GFP control and AAV9-Sav-shRNA high dose (Sav high). * or #P < 0.05, ** or ##P < 0.01, and *** or ###P < 0.001. B, E, G, H, and I include one pig treated with AAV9-GFP and one pig treated with low dose AAV9-Sav-shRNA that were both euthanized at day 74 post myocardial infarction. (J) Representative images show pig hearts that were harvested 90 days after viral vector injection (P-1918, AAV9-GFP control; P-1917, AAV9-Sav-shRNA). Each pig underwent myocardial infarction at the age of 92 days, received viral vector at the age of 106 days, and was euthanized at the age of 196 days. Scale bar, 2 cm. (K) Shown are four representative heart slices from a total of 7 slices (slice numbers 3, 4, 5, and 6) for pigs P-1918 (AAV9-GFP control) and P-1917 (AAV9-Sav-shRNA). Scale bar, 2 cm. (L) Shown is quantification of scar size (AAV9-GFP, n = 7; combined low- and high-dose AAV9-Sav-shRNA, n = 11). The Mann-Whitney test was used for the comparison. Data are presented as the means ± SEM. *P < 0.05.
