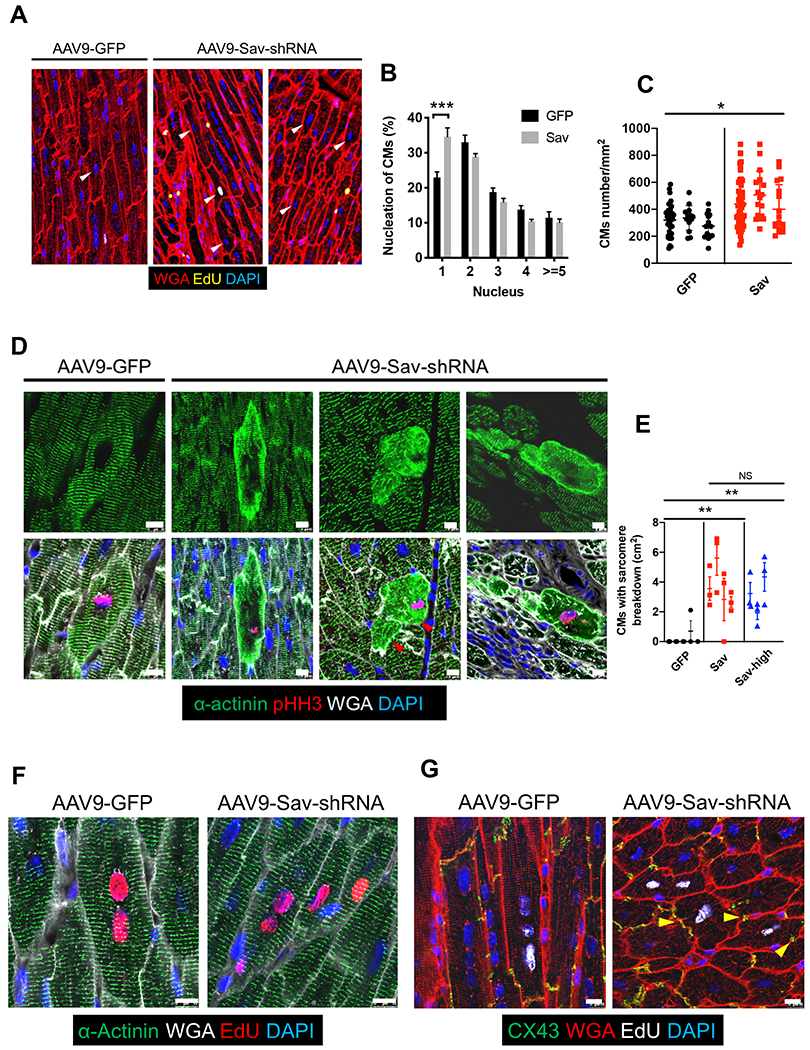
Fig. 5. Sarcomere breakdown and cardiomyocyte division in pigs injected with AAV9-Sav-shRNA after myocardial infarction.

(A) Shown is a representative image of a pig heart showing the number of nuclei in cardiomyocytes. White arrowheads indicate cardiomyocytes with one nucleus. (B) Shown is the percentage of cardiomyocytes with a different number of nuclei. For each pig, at least four tiled images were analyzed (n = 4). A total of 1327 cells were counted in the AAV9-GFP (GFP, control) group, and 1298 cells were counted in the high-dose AAV9-Sav-shRNA (Sav) group. ANOVA with Bonferroni’s post hoc test was used for comparisons. (C) Cardiomyocyte numbers in the GFP-positive area of a representative pig heart from each group are shown: AAV9-GFP control (GFP); AAV9-Sav-shRNA, low and high dose combined (Sav). Each dot represents counted cardiomyocytes in a GFP-positive area (normalized to mm2) (n = 3). (D) Immunofluorescence stainings for pHH3 and sarcomere actinin are shown for representative sections from hearts in each group: AAV9-GFP control (GFP); low-dose AAV9-Sav-shRNA (Sav). Red arrowheads indicate dividing cardiomyocytes with sarcomere breakdown positioned side by side. Scale bars, 10 μm. (E) Shown is quantification of data in (D) (n = 5 for AAV9-GFP–injected hearts; n = 4 for low-dose AAV9-Sav-shRNA–injected hearts, and n = 3 for high-dose AAV9-Sav-shRNA–injected hearts). We quantified three different sections for each pig heart. Two-way ANOVA with Bonferroni’s post hoc test was used for comparisons in (B); nested t tests were used for comparisons in (C); nested one-way ANOVA with Tukey’s post hoc test were used for comparisons in (E). Data are presented as the means ± SEM. *P < 0.05, **P < 0.01, and ***P < 0.001. (F) Shown is immunofluorescence staining for EdU and sarcomere actinin in cardiomyocytes from pig hearts injected with AAV9-GFP control or low-dose AAV9-Sav-shRNA. Coupled EdU-positive parent and daughter cardiomyocytes retain normal sarcomere structure after cell division in AAV9-Sav-shRNA–injected pig hearts. Scale bars, 10 μm. (G) Shown is immunofluorescence staining for EdU and connexin 43 (CX43) in cardiomyocytes from pig hearts injected with AAV9-GFP control or AAV9-Sav-shRNA. Coupled EdU-positive cardiomyocytes connect with each other via CX43 after cell division in AAV9-Sav-shRNA–injected pig hearts. Yellow arrowheads indicate CX43 staining. Scale bars, 25 μm.
