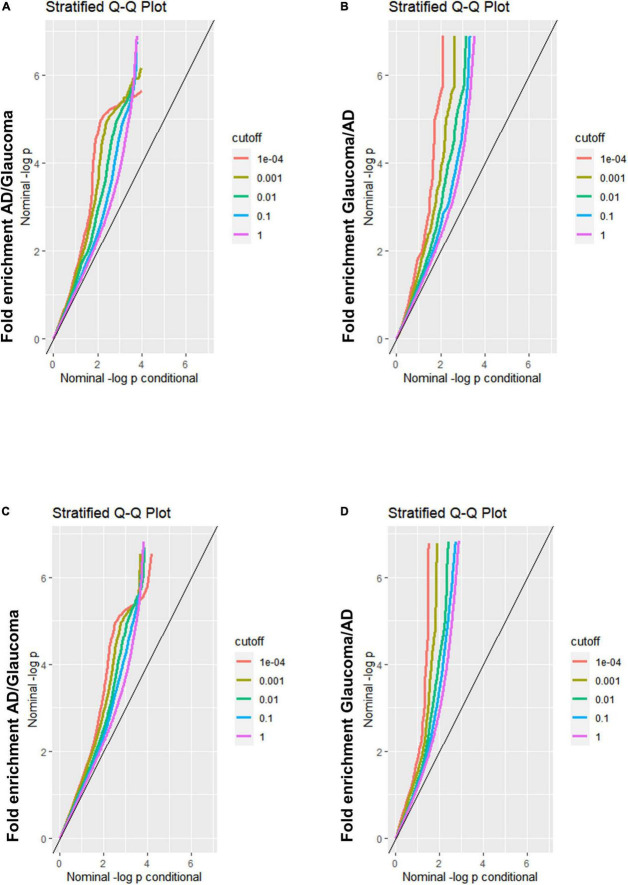
FIGURE 1.
Fold-enrichment plots for genetic association analysis between AD and glaucoma discovery/replication samples. (A) Fold-enrichment plot of nominal –log10(p) for SNPs association with AD as a function of statistical significance for SNPs association with glaucoma discovery sample. The straight lines with sharp upward deviated tails showed the true associations between AD and glaucoma discovery sample. (B) Fold-enrichment plot of nominal –log10(p) for SNPs association with glaucoma discovery sample as a function of statistical significance for SNPs association with AD. The straight lines with sharp upward deviated tails showed the true associations between glaucoma discovery sample and AD. (C) Fold-enrichment plot of nominal –log10(p) for SNPs association with AD as a function of statistical significance for SNPs association with glaucoma replication sample. The straight lines with sharp upward deviated tails showed the true associations between AD and glaucoma replication sample. (D) Fold-enrichment plot of nominal –log10(p) for SNPs association with glaucoma replication sample as a function of statistical significance for SNPs association with AD. The straight lines with sharp upward deviated tails showed the true associations between glaucoma replication sample and AD.

