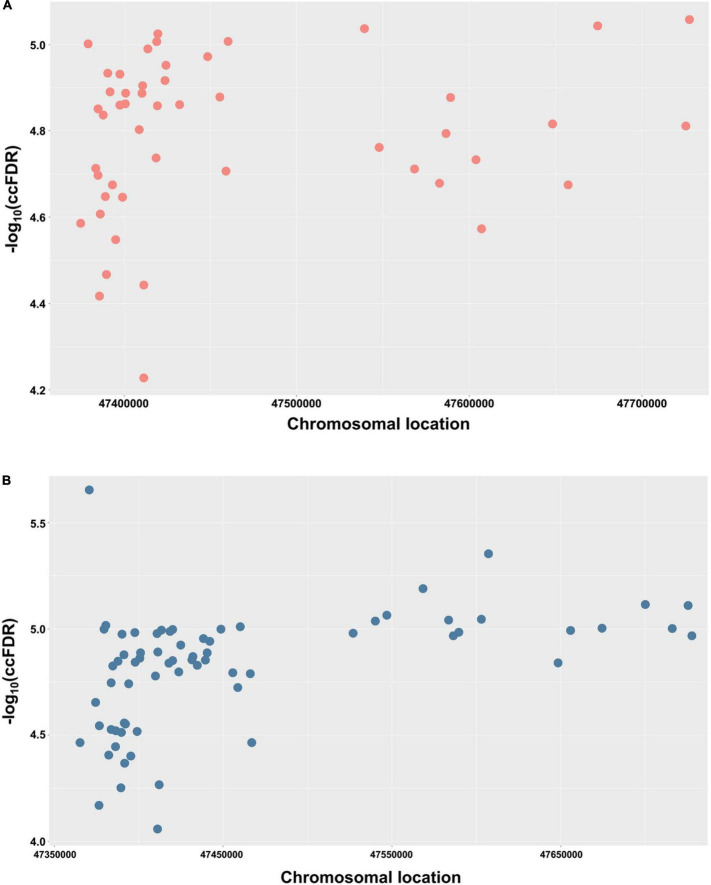
FIGURE 2.
Conjunctional Manhattan plots depict the chromosomal location of each tested shared genetic loci between AD and glaucoma. (A) Conjunctional Manhattan plot of chromosomal locations and –log10(ccFDR) values for associated SNPs of AD and glaucoma discovery sample. (B) Conjunctional Manhattan plot of chromosomal locations and –log10(ccFDR) values for associated SNPs of AD and glaucoma replication sample. The X-axis is the chromosomal locations of significant shared loci. The Y-axis is the calculated –log10(ccFDR) of significant shared loci. Detailed information about chromosomal locations for all significant loci is shown in Table 1.

