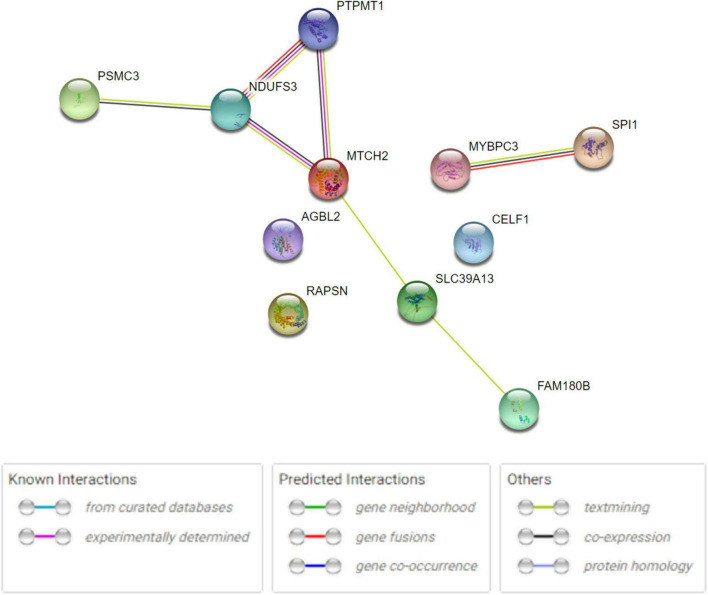
FIGURE 3.
Human PPI network analysis for 11 shared genes between AD and glaucoma. PPI network connectivity for proteins identified in both AD and glaucoma. PPI results are based on the experimental evidence with the String database (https://string-db.org) (version 11.5). Network nodes represent proteins produced by the protein-coding gene loci. Edges between nodes indicate protein–protein interactions. The network contains 11 nodes with 7 edges.

