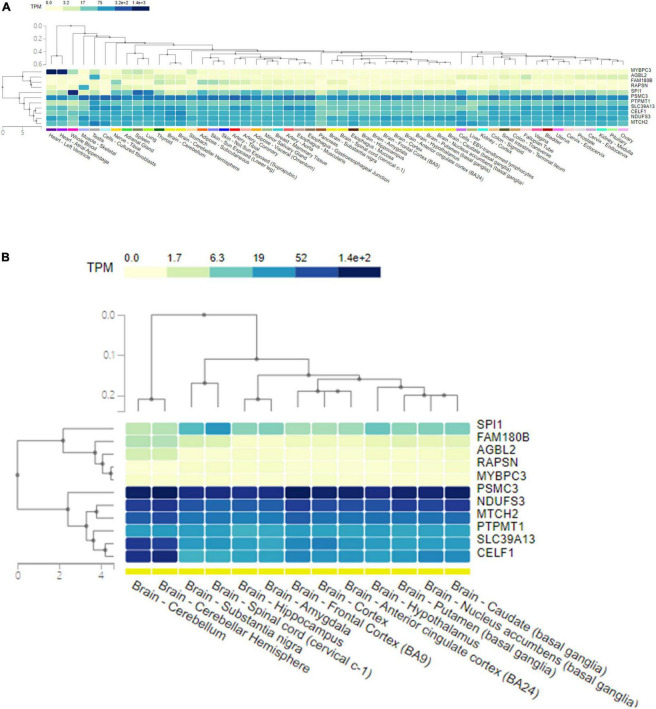
FIGURE 4.
The expression level of 11 pleiotropic genes shared by AD and glaucoma in human tissues. (A) A heat map of the expression level of 11 pleiotropic genes shared by AD and glaucoma in all human tissues. The shared genes and the detected tissues were clustered by hierarchical clustering. The corresponding expression level of the gene in tissue was colored according to the linear count of the indicated TPM. (B) A heat map of the expression level of 11 pleiotropic genes shared by AD and glaucoma in human brain tissues. The shared genes and the detected brain tissues were clustered by hierarchical clustering. The corresponding expression level of the gene in brain tissue was colored according to the linear count of the indicated TPM. TPM represents transcript per million.

