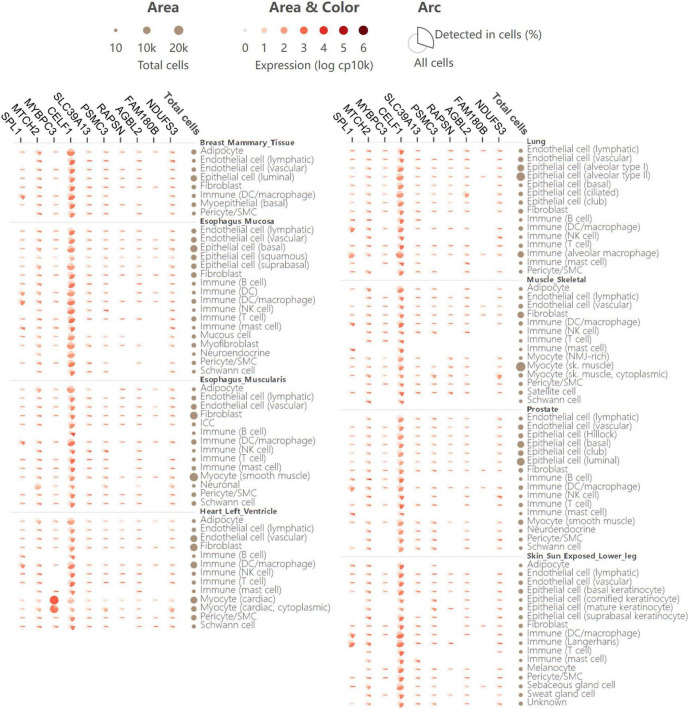
FIGURE 5.
Single-cell expression analysis of 11 pleiotropic genes shared by AD and glaucoma in various human cell types and tissues. Single-cell expression levels of 11 shared pleiotropic genes in provided human cell types and tissues. In the matric format displayed as an aster plot, each row indicates one cell type from its tissue and each column indicates one gene. The arc area and color represent the comparison of the expression of all cells versus cells in which the gene is detected. The arc length presents the fraction of cells in which a gene is detected.

