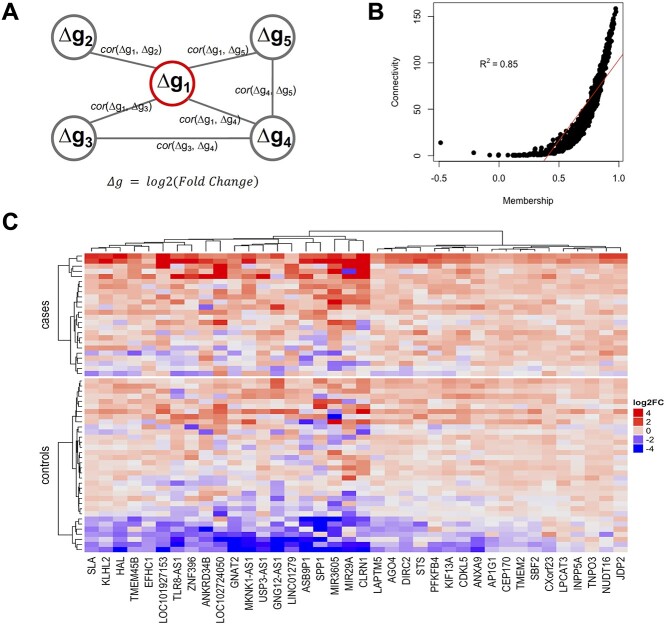
Figure 2.
(A) Illustration of our network methodology. In contrast to a conventional coexpression network, each node is a gene with its change in expression (Δg) over time. An edge between nodes is determined by the correlation in expression change across individuals between the corresponding nodes. Thus, the methodology aims to prioritize genes that may regulate the change in expression (Δg), rather than expression level, of partner genes. (B) Scatter plot of NMS and connectivity in network 5, showing significant correlation between the two metrics. The red line indicates the linear regression line. (C) Heatmap of key genes in network 5 (i.e. genes with correlation with transition >0.3). The color presents the log2 transformed fold change of follow-up over baseline for each gene, which we used to quantify Δg. Both subjects and genes are clustered by Ward’s minimum variance. The cluster analysis for genes is unsupervised and the subjects are forced to separate into two groups; cases and controls.

