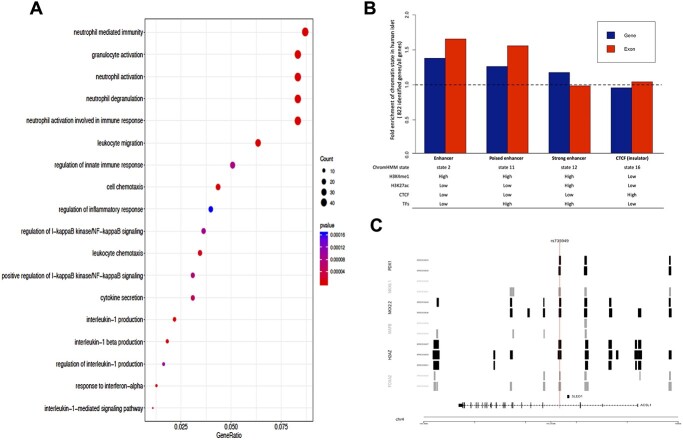
Figure 3.
(A) Dot plot of gene ontology enrichment analysis. The diameter indicates the number of genes overlapping the gene ontology term and the color indicates the enrichment P-value. The figure was generated using the R package clusterProfiler. (B) Bar plot for the fold enrichment of 822 genes and their exonic regions in our identified network compared to all RefSeq genes and corresponding exonic regions in enhancer, poised enhancer, active enhancer and insulator regions. (C) Known GWAS T2D SNP (rs735949) overlaps islet transcription factor binding sites from ChIP-Seq data. The transcript structure of the gene ACSL1 from module 5 is also shown at bottom.

