Figure 3.

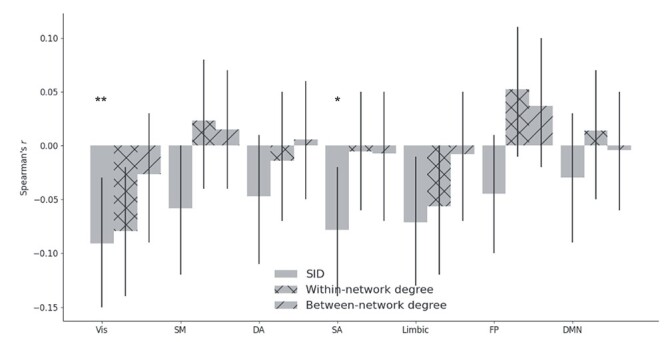
The strength of the statistical relation between temporal network measures (SID, within-, and between-network degree centrality) and pain ratings. Error bars show 95% CI. One star means Pcorr < 0.05 and two stars for Pcorr < 0.01.

The strength of the statistical relation between temporal network measures (SID, within-, and between-network degree centrality) and pain ratings. Error bars show 95% CI. One star means Pcorr < 0.05 and two stars for Pcorr < 0.01.