
Figure 2.
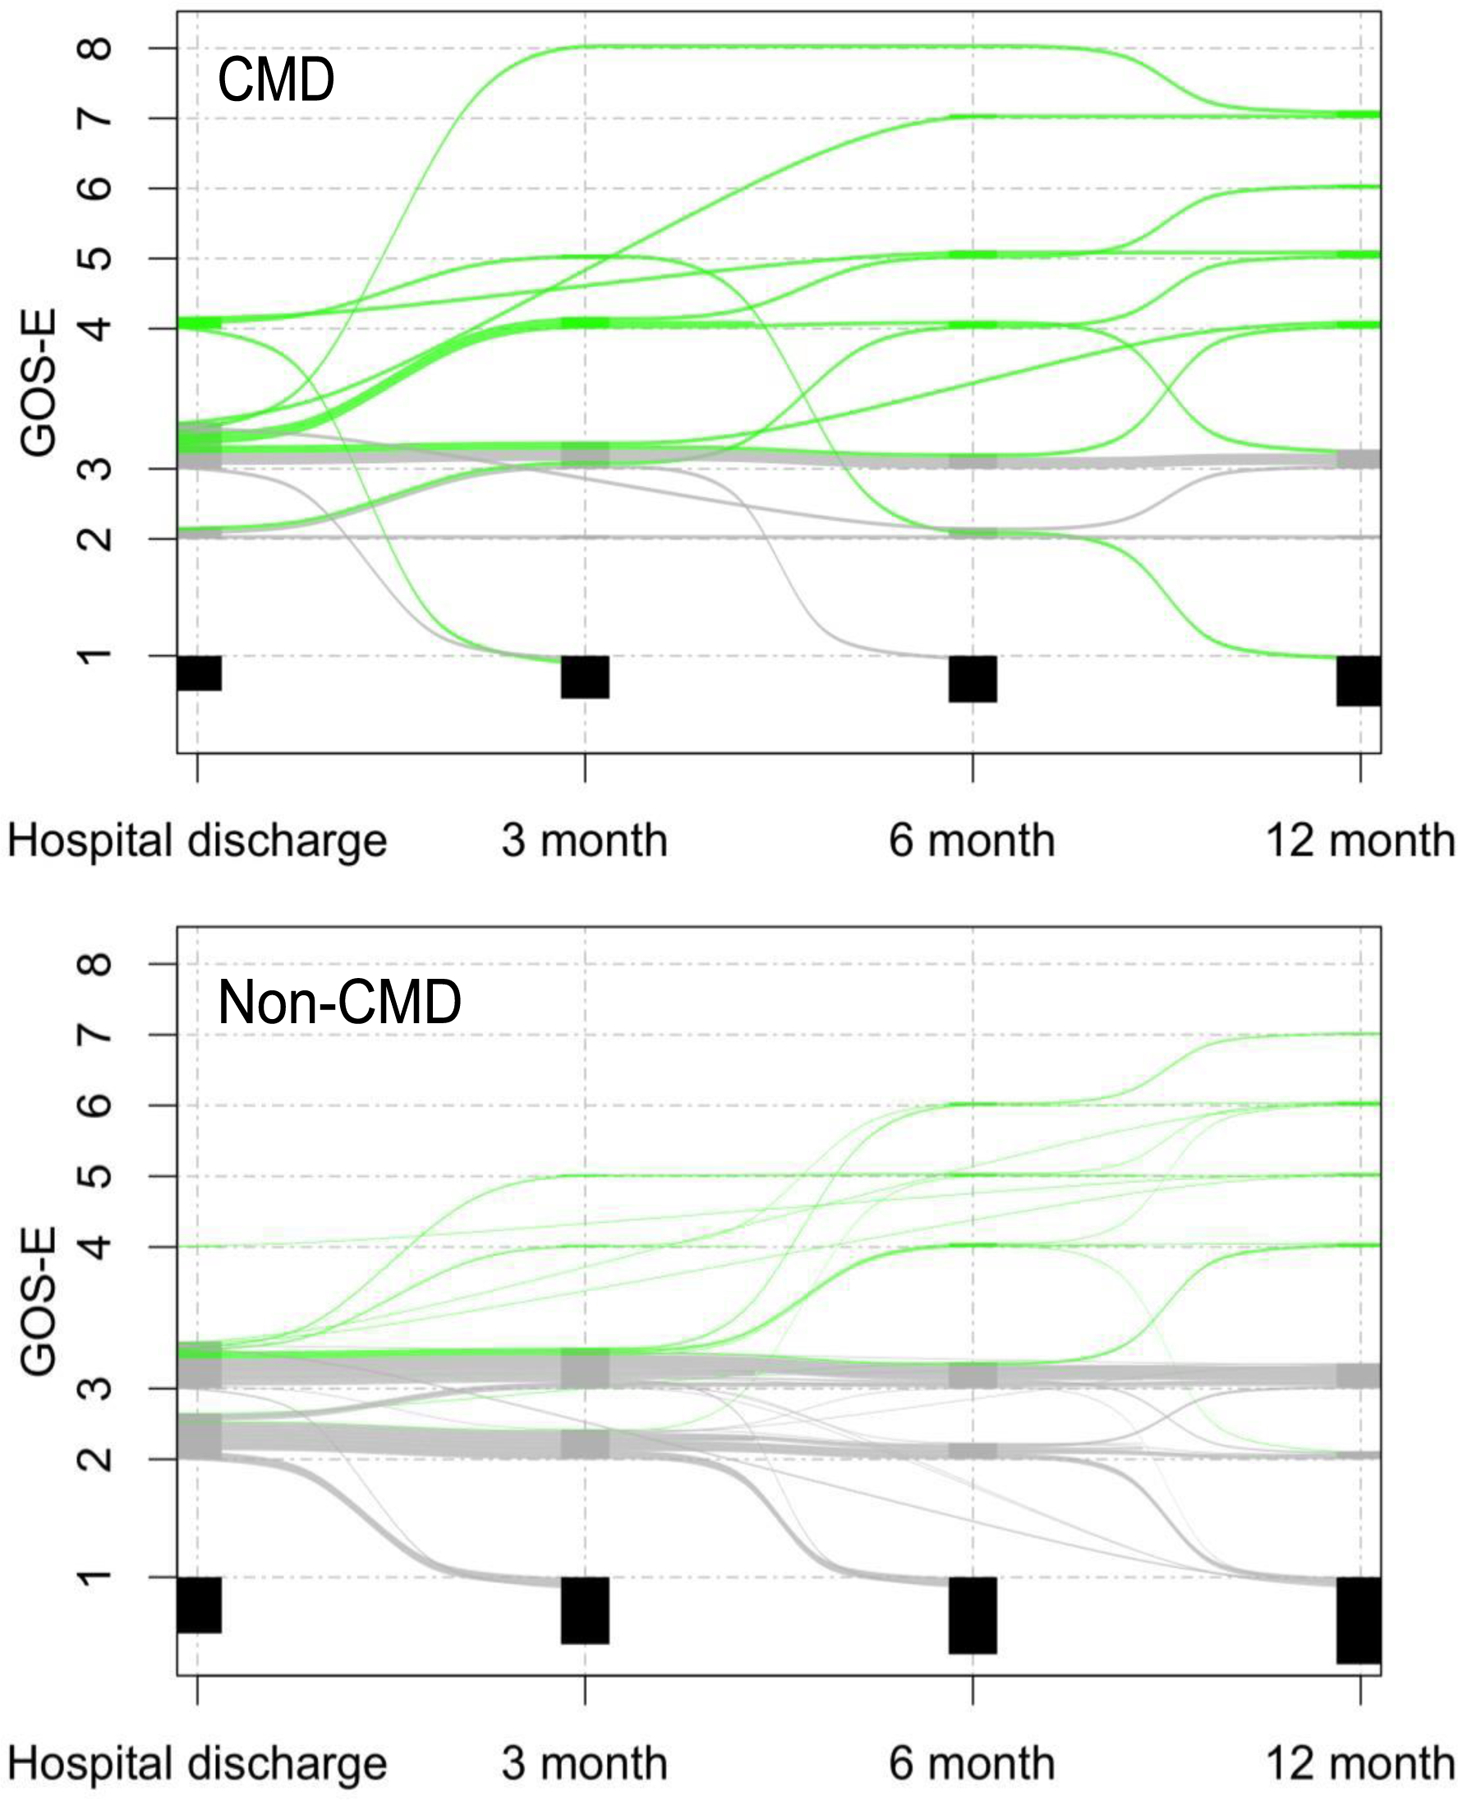
Recovery trajectory over the first year following acute brain injury
Alluvial plots representing individual GOS-E development across follow-up time points in patients with acute brain injury. Top plot CMD patients (N=27) and bottom plot non-CMD patients (N=166). Green lines indicate patients that recovered to a GOS-E of 4 or above at any point in time by one year after the injury, grey lines indicate patients were alive by 12 months but did not improve to a GOS-E of 4 or above, and black boxes indicate those patients that were dead by the time of these respective follow-up time-points. GOS-E, Glasgow Outcome Scale-Extended.