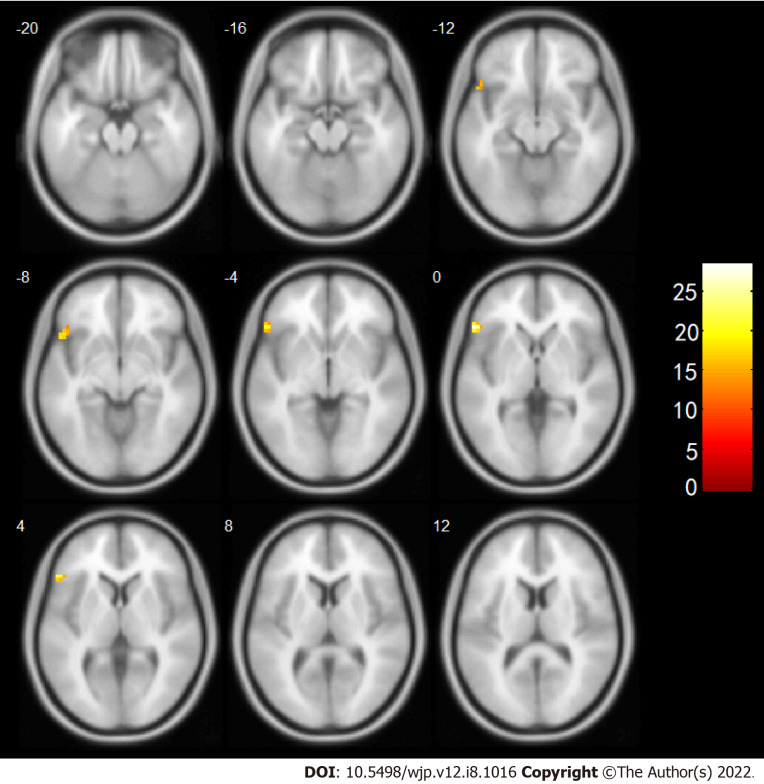
Figure 3.
Increased connectivity with the right superior gyrus after intervention. The numbers in the figure represent the axial coordinates of the brain profile in Montreal Neurological Institute space, and the brightness of the color represents the significance level of the interaction, with brighter color indicating higher significance.

