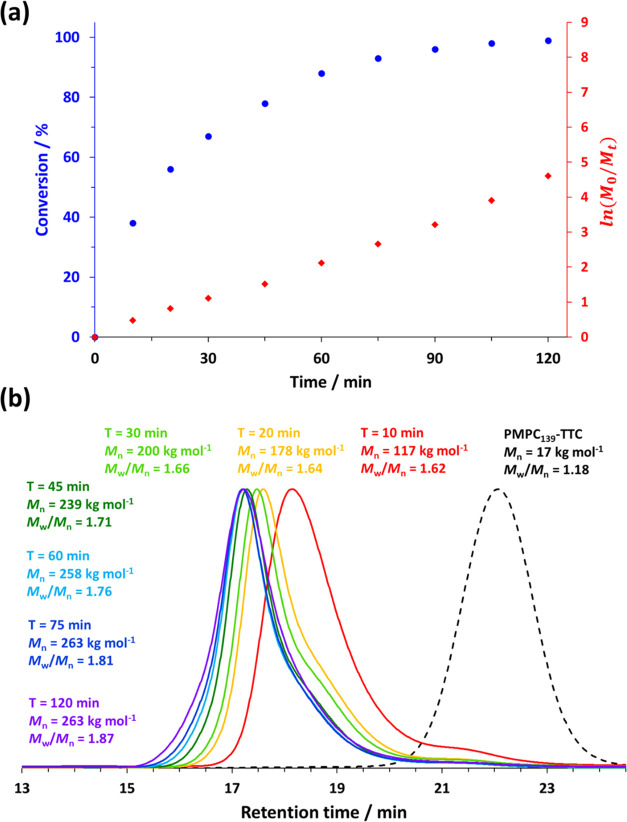
Figure 3.
(a) Conversion vs time curve and corresponding semilogarithmic plot determined by 1H NMR spectroscopy for the RAFT aqueous dispersion polymerization of DMAC at 30 °C in 2.0 M ammonium sulfate when targeting a PDMAC DP of 5000 at 20% w/w solids. (b) Aqueous GPC curves obtained by periodic sampling of the reaction mixture to monitor the evolution in the molecular weight distribution (see Figure S3 for the corresponding normalized GPC curves).

