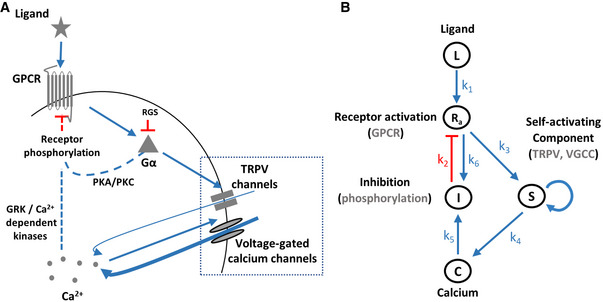
Figure 1. Illustration of the core GPCR signaling pathway and the analogous model.

-
AKey components of the GPCR signaling pathway. Dashed lines mark canonical GPCR pathways, though they have not been verified yet in the AWA neuron.
-
BAn analogous circuit topology that recapitulates the main signaling events related to calcium dynamics. Note that S (TRPV and VGCC) depicts a self‐amplifying module to generate the pulsatile activity. Symbols next to arrows mark the relevant constant in the model's equations. Blue arrows indicate activation, and red lines mark inhibition.
