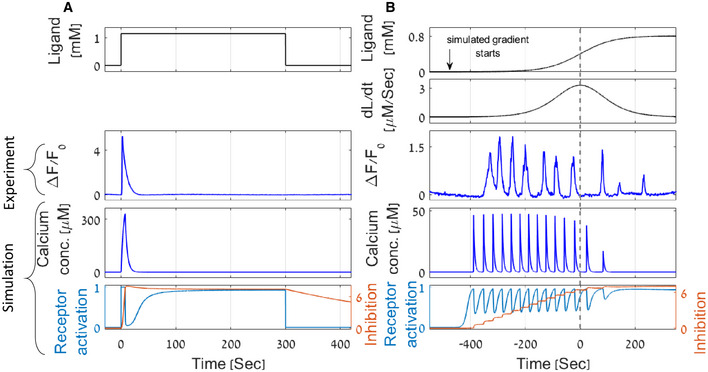
Figure 2. A parsimonious mathematical model recapitulates experimental results demonstrating exact adaptation, pulsatile coding, and adaptation to the magnitude of the first derivative.

-
A, BExperimental results and model simulations of calcium levels in response to a step function (A) and to a smooth sigmoidal function (B) of the stimulus. (A) Following an on step, and during stimulus presentation, calcium levels rise and then return to their basal levels (exact adaptation in experiment and simulation). Receptor activity () and inhibition levels () reach a new steady state. (B) A sigmoidal gradient of the stimulus elicits a series of calcium pulses that are stronger in the first half of the sigmoid, thus demonstrating adaptation to the gradient's first derivative (dashed line marks the sigmoid midpoint, where the first derivative is maximal). This feature is observed in both experiments and simulations. The stair‐shape inhibition constitutes a discrete memory of previous input levels. Top two panels show the gradient and its derivative. Middle panels depict a representative result of AWA calcium imaging. The two bottom panels present calcium concentrations (), receptor activation (), and inhibition () levels as simulated by the model for the same gradient. Calcium dynamics was measured using a strain expressing GCaMP in the AWA neuron and is denoted as the GCaMP fluorescence fold change from the initial state . Diacetyl (stimulus) was presented to the worm using a custom‐made microfluidic device (see Materials and Methods).
Source data are available online for this figure.
