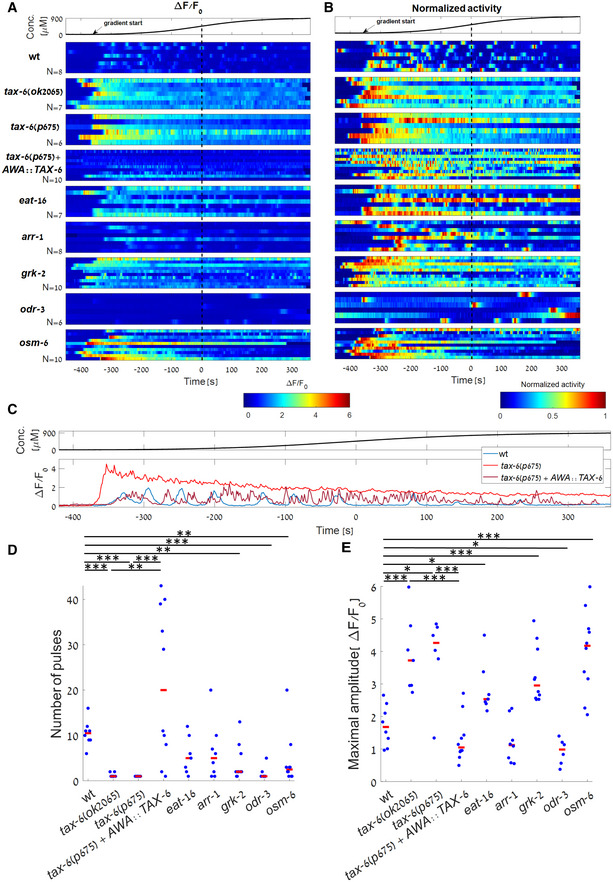
Figure 3. Analysis of dynamic responses and adaptation in different mutant backgrounds.

-
A, BResponse profiles of individual wt and mutant worms to a sigmoidal gradient (top). Shown are the fold change activity (A) and the normalized activity (B) of wt, tax‐6(ok2065), tax‐6(p675), tax‐6(p675) + AWA::TAX‐6, eat‐16, arr‐1, grk‐2, odr‐3 and osm‐6 mutant worms ( worms, respectively). Due to the high variability of the GCaMP baseline fluorescence, , between and within each of the mutant strains, we considered fluorescence fold change, , when analyzing pulsatile activity. Tax‐6 mutants lacked any pulsatile activity (raw traces are shown in Appendix Fig S3). Time is aligned to the gradient's inflection point, in which the first derivative is maximal (dotted black line). Arrow marks the approximated time in which odorant levels start to rise.
-
CRepresentative traces of wt, tax‐6(p675), and tax‐6(p675) + AWA:TAX‐6 worms (taken from the first row of each strain in panel A).
-
D, ETo quantify the differences in activity between wt worms and the various mutants, we extracted individual pulses (see Materials and Methods). When compared with wt, number of pulses was significantly lower in tax‐6(ok2065), tax‐6(p675), grk‐2, odr‐3, and osm‐6 mutants (, respectively). Maximal amplitude was significantly higher in tax‐6(ok2065), tax‐6(p675), eat‐16, grk‐2, and osm‐6 mutants (P = 0.002, 0.02, 0.02, 0.002, 0.003 respectively) and significantly lower in odr‐3 mutants (P = 0.04). In both tax‐6 mutant alleles (ok2065 and p675), the number of pulses was significantly lower when compared with the rescued strain ( respectively), and the maximal amplitude was significantly higher (, respectively). Wilcoxon rank‐sum test, FDR corrected for the 20 comparisons. Red bar marks the median. *P < 0.05, **P < 0.01, ***P < 0.005.
Source data are available online for this figure.
