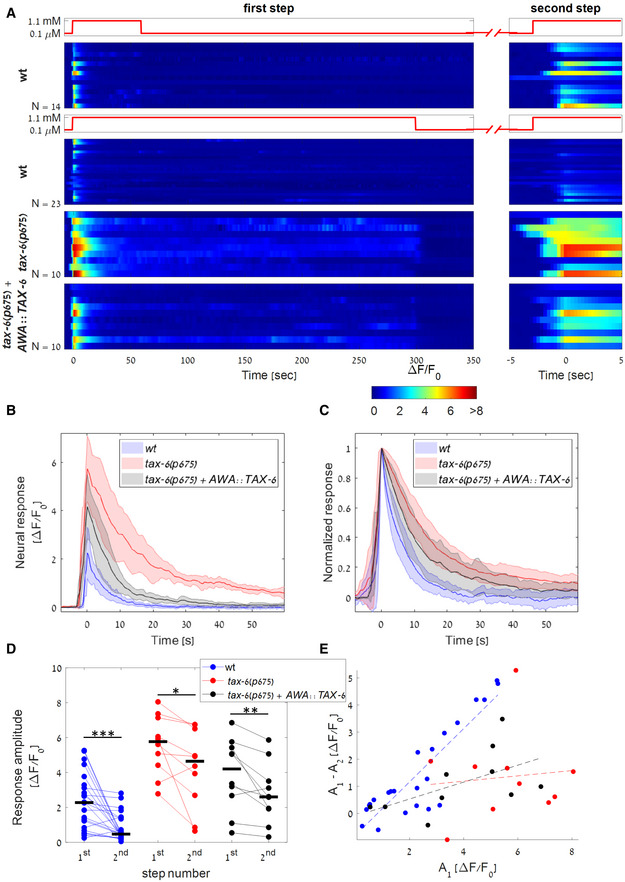
Figure 4. TAX‐6/Calcineurin is required for exact adaptation and habituation.

-
AResponse dynamics of wt, tax‐6(p675), and tax‐6(p675) + AWA::TAX‐6 worms to a two‐step protocol: First step consisting of 5 min (bottom panels, worms respectively) or 1 min (top panel, wt worms. Biological replicates) of on step, followed by a 2 min, or 6 min off step, respectively, before applying a second short step (right panels). Wt worms exposed to the 5‐min step showed stronger habituation compared to worms exposed to the 1‐min‐long step (, Wilcoxon rank‐sum test between the amplitudes of the second steps). Steps are aligned to the maximal amplitude (at time 0).
-
B, CMedian neural activity (B) and normalized neural activity (C) of wt, tax‐6(p675), and tax‐6(p675) + AWA::TAX‐6 worms in response to the first step. Fitting the pulse decay with an exponent of the shape , tax‐6 mutants showed a longer decay time than wt worms, suggesting slower adaptation dynamics ( of and s, respectively, Wilcoxon rank‐sum test, ). of the rescue line was s, which was not significantly different from wt (Wilcoxon rank‐sum test, ). Color‐shaded area marks mean absolute deviation.
-
DComparison of the amplitudes in the first and the second step for wt, tax‐6(p675), and tax‐6(p675) + AWA::TAX‐6 worms (following the longer 5‐min step). All three strains showed a weaker activity in the second step (signed‐rank test, , respectively), with tax‐6(p675) worms having a significantly higher amplitude than wt in both the first and second steps (Wilcoxon rank‐sum test, and respectively). Black bars mark the median. *P < 0.05, **P < 0.01, ***P < 0.005.
-
EThe difference between the response amplitudes of the first and the second steps as a function of the first‐step amplitude. While wt worms show a higher amplitude difference when the response to the first step is stronger (), tax‐6(p675) mutants do not (r = 0.1, P = 0.78), suggesting that calcium influx affects habituation in wt worms but not in tax‐6(p675) mutants. The linear dependency in the rescued animals (tax‐6(p675) + AWA::TAX‐6) is higher than in tax‐6 mutants, though the correlation is not significant ().
Source data are available online for this figure.
