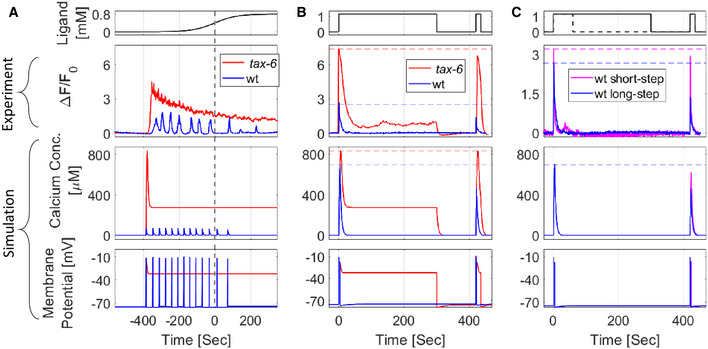
Figure 6. A detailed mathematical model recapitulates experimental results of both wt and tax‐6 mutant worms.

In the detailed model (see Appendix Note S1 part 4), we integrated the available dynamics of the AWA ion channels (Liu et al, 2018). To simulate circuit dynamics of tax‐6 mutants, we set the contribution of calcium‐mediated inhibition to zero ( in equation 4 and shown in Fig 1B).
-
A–CCalcium concentration and membrane potential as simulated by the model, alongside calcium imaging measurements of a representative worm in response to different stimulation patterns (top). (A) In response to a sigmoidal gradient, simulated tax‐6 worms fail to generate pulsatile activity, in agreement with the experimental results. Also, activity does not resume to its baseline levels. (B) Response dynamics following a first long on step (identical to experiment protocol described in Fig 4). Experimental and simulated wt worms exhibit reduced amplitude responses (increased habituation) following the second on step. In contrast, tax‐6 mutants did not show exact adaptation nor a reduced activity in response to the second on step (no habituation). (C) Response dynamics of wt worms following a first long (continues line) or short (dashed line) on step. A second on step following a short on step (and hence a long off step), elicits calcium levels that match the first step (purple). This contrasts with the attenuated response following a long on step (and hence short off step, blue). Even though in both protocols, calcium concentrations returned to baseline levels, the longer the off step, the higher the response activity to a second step (in agreement with experimental results, Fig 4A), suggesting that calcium‐independent processes contribute to the inhibition. Note the different y‐scale for the experimental results in panels (B) and (C).
Source data are available online for this figure.
