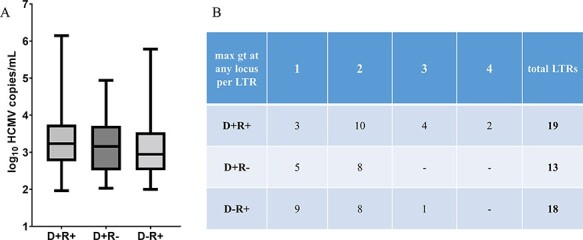
Figure 3.

Viral load and maximum number of genotypes (max gt) in LTRs with For Review Only different HCMV serostatus combinations of D and R. (A) No significant difference in viral load between the three HCMV serostatus combination groups is observed (P = 0.2626, n = 163, Kruskal–Wallis test plus post hoc Dunn’s multiple comparisons test). (B) The maximum number of genotypes (gt) at any of the five loci detected for each LTR is provided (n = 50).
