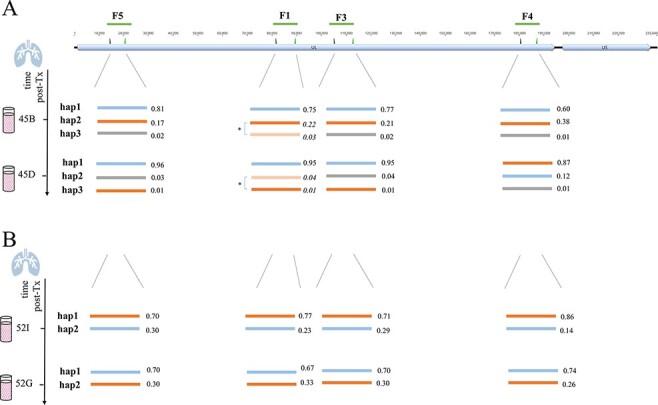
Figure 6.

Schematic presentation of haplotypes of longitudinally PacBio-sequenced BAL samples of LTR-45 (A) and LTR-52 (B). The top track shows the overall HCMV genome structure that consists of a UL and a US region with the long amplicon target regions (F5, F1, F3, and F4) depicted as green lines. Haplotypes determined for each of the four long amplicon regions are presented as lines of different colours. The values next to each haplotype are the relative frequencies of the respective haplotypes. (A) The two sub-haplotypes of LTR-45 of region F1 (marked with an asterisk) were initially detected as a single haplotype (hap2), since they only differed in twelve nucleotides across the whole fragment (further details in ‘Results’ section and Supplementary Table S4C). Here, they are shown as separate haplotypes and the calculated relative frequencies are shown in italic. (B) For LTR-52, similar relative frequencies of both haplotypes of each region suggest their statistical linkage. A change in predominance is observed between both time points and supports that orange and blue haplotypes are linked, respectively. nt, nucleotide.
