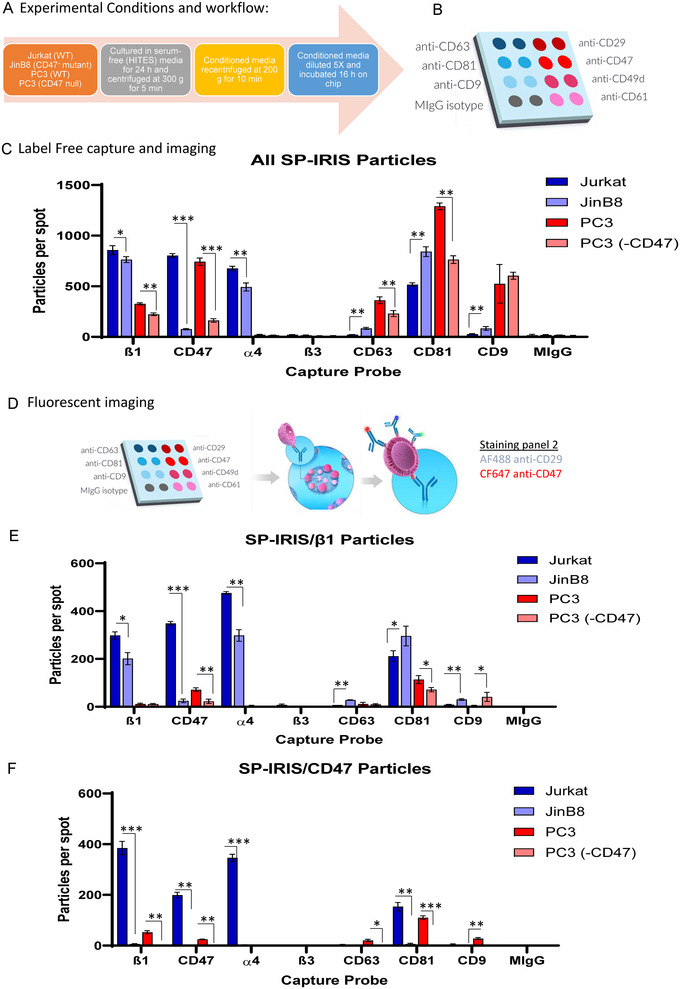
FIGURE 1.

(A) Experimental conditions for collection of supernatants from WT and CD47 mutant Jurkat T Lymphoblast and PC3 prostate carcinoma cells. (B) Custom antibody array on ExoView Chip. (C) Total label‐free, SP‐IRIS particle analysis of 50–200 nm EVs released from Jurkat and PC3 cells captured on spots with antibodies specific for β1 integrins (CD29), CD49d (α4), CD61 (β3), CD47, and the tetraspanins CD63, CD81 and CD9 EVs. Error bars indicate SD, N = 3. (D) Overview of workflow labelling captured EVs using CF647‐anti‐CD47 and AF488‐anti‐CD29. (E) Fluorescent imaging using CF647‐anti‐CD47 to detect CD47+ EVs captured on customized antibody array chip (Panel C). (F) Fluorescent imaging using AF488‐anti‐CD29 to detect β1+ EVs captured on the customized antibody array chip (Panel C). Significant values were calculated using t‐test: two‐sample assuming equal variances for each capture spot (n = 3). Asterisks indicate p‐values: * = P > 0.05, ** = P > 0.0002, and *** = P > 0. 00003
