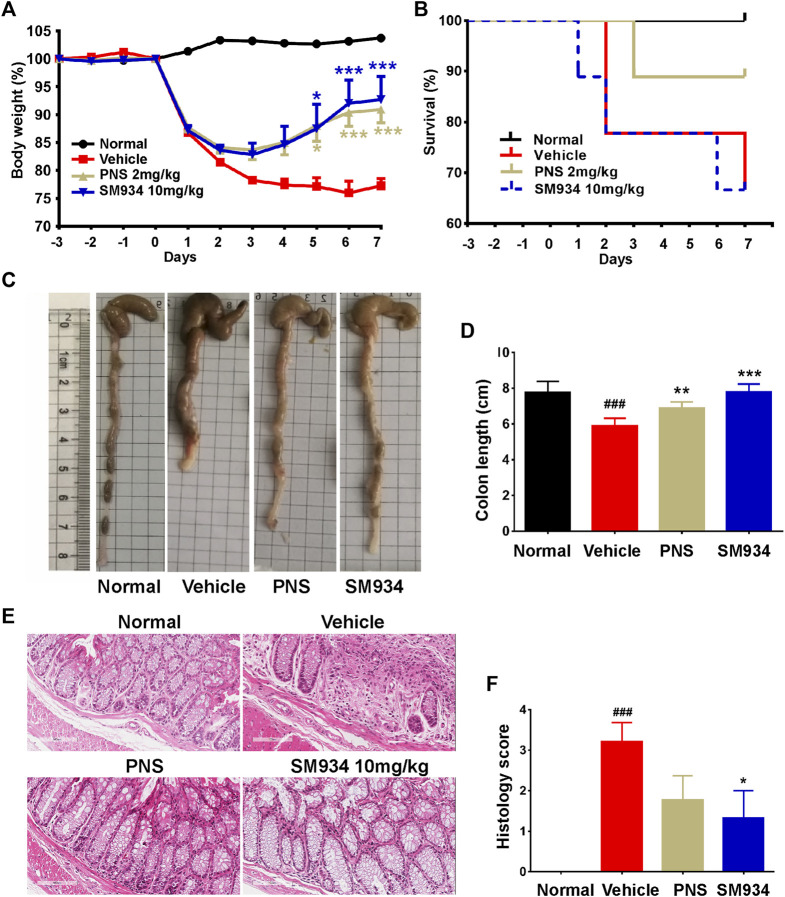
FIGURE 1.
Effects of SM934 on TNBS-induced colitis in mice. (A) Body weight was monitored daily. (B) Survival curve. (C) Representative image of colons. (D) Average colon length of all groups. (E) Representative images of H&E-stained colon sections in mice (scale bars, 400 µm). (F) Histological score of mice in each group. Data are presented as means ± SEM (n = 9 mice/group). ### p < 0.001 vs. normal group; *p < 0.05, **p < 0.01, and ***p < 0.001 vs. vehicle group.

