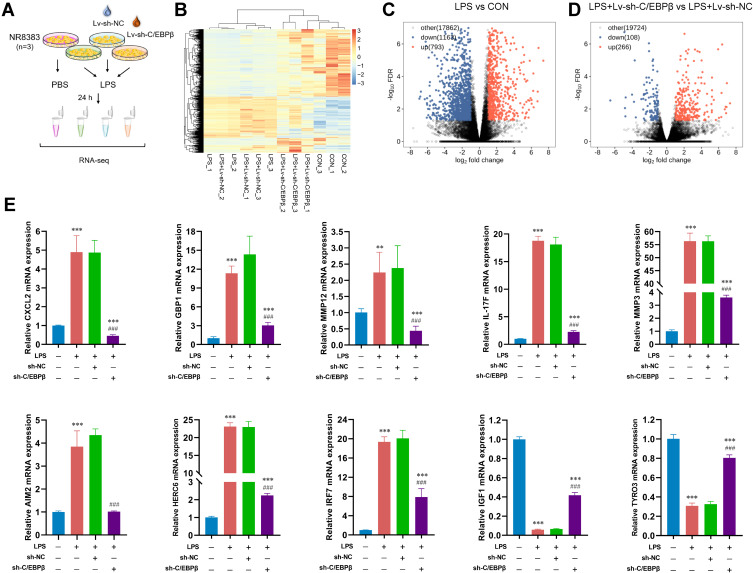
Figure 2.
RNA-seq analysis of DEGs after C/EBPβ inhibition. (A) Flow chart of sample preparation for RNA-seq. (B) Heat maps of differentially expressed genes (DEGs). (C) Volcano plot indicating substantial changes in gene expression between the LPS and CON groups (up) and (down). (D) Volcano plot indicating substantial changes in gene expression between the LPS + Lv-sh-C/EBPβ and LPS + Lv-sh-NC groups (up) and (down). (E) Validation of C/EBPβ-regulated DEGs in alveolar macrophages using RT-qPCR. **p < 0.01, and ***p < 0.001 compared with the CON group. ###p < 0.001 compared with the LPS + sh-NC group.

