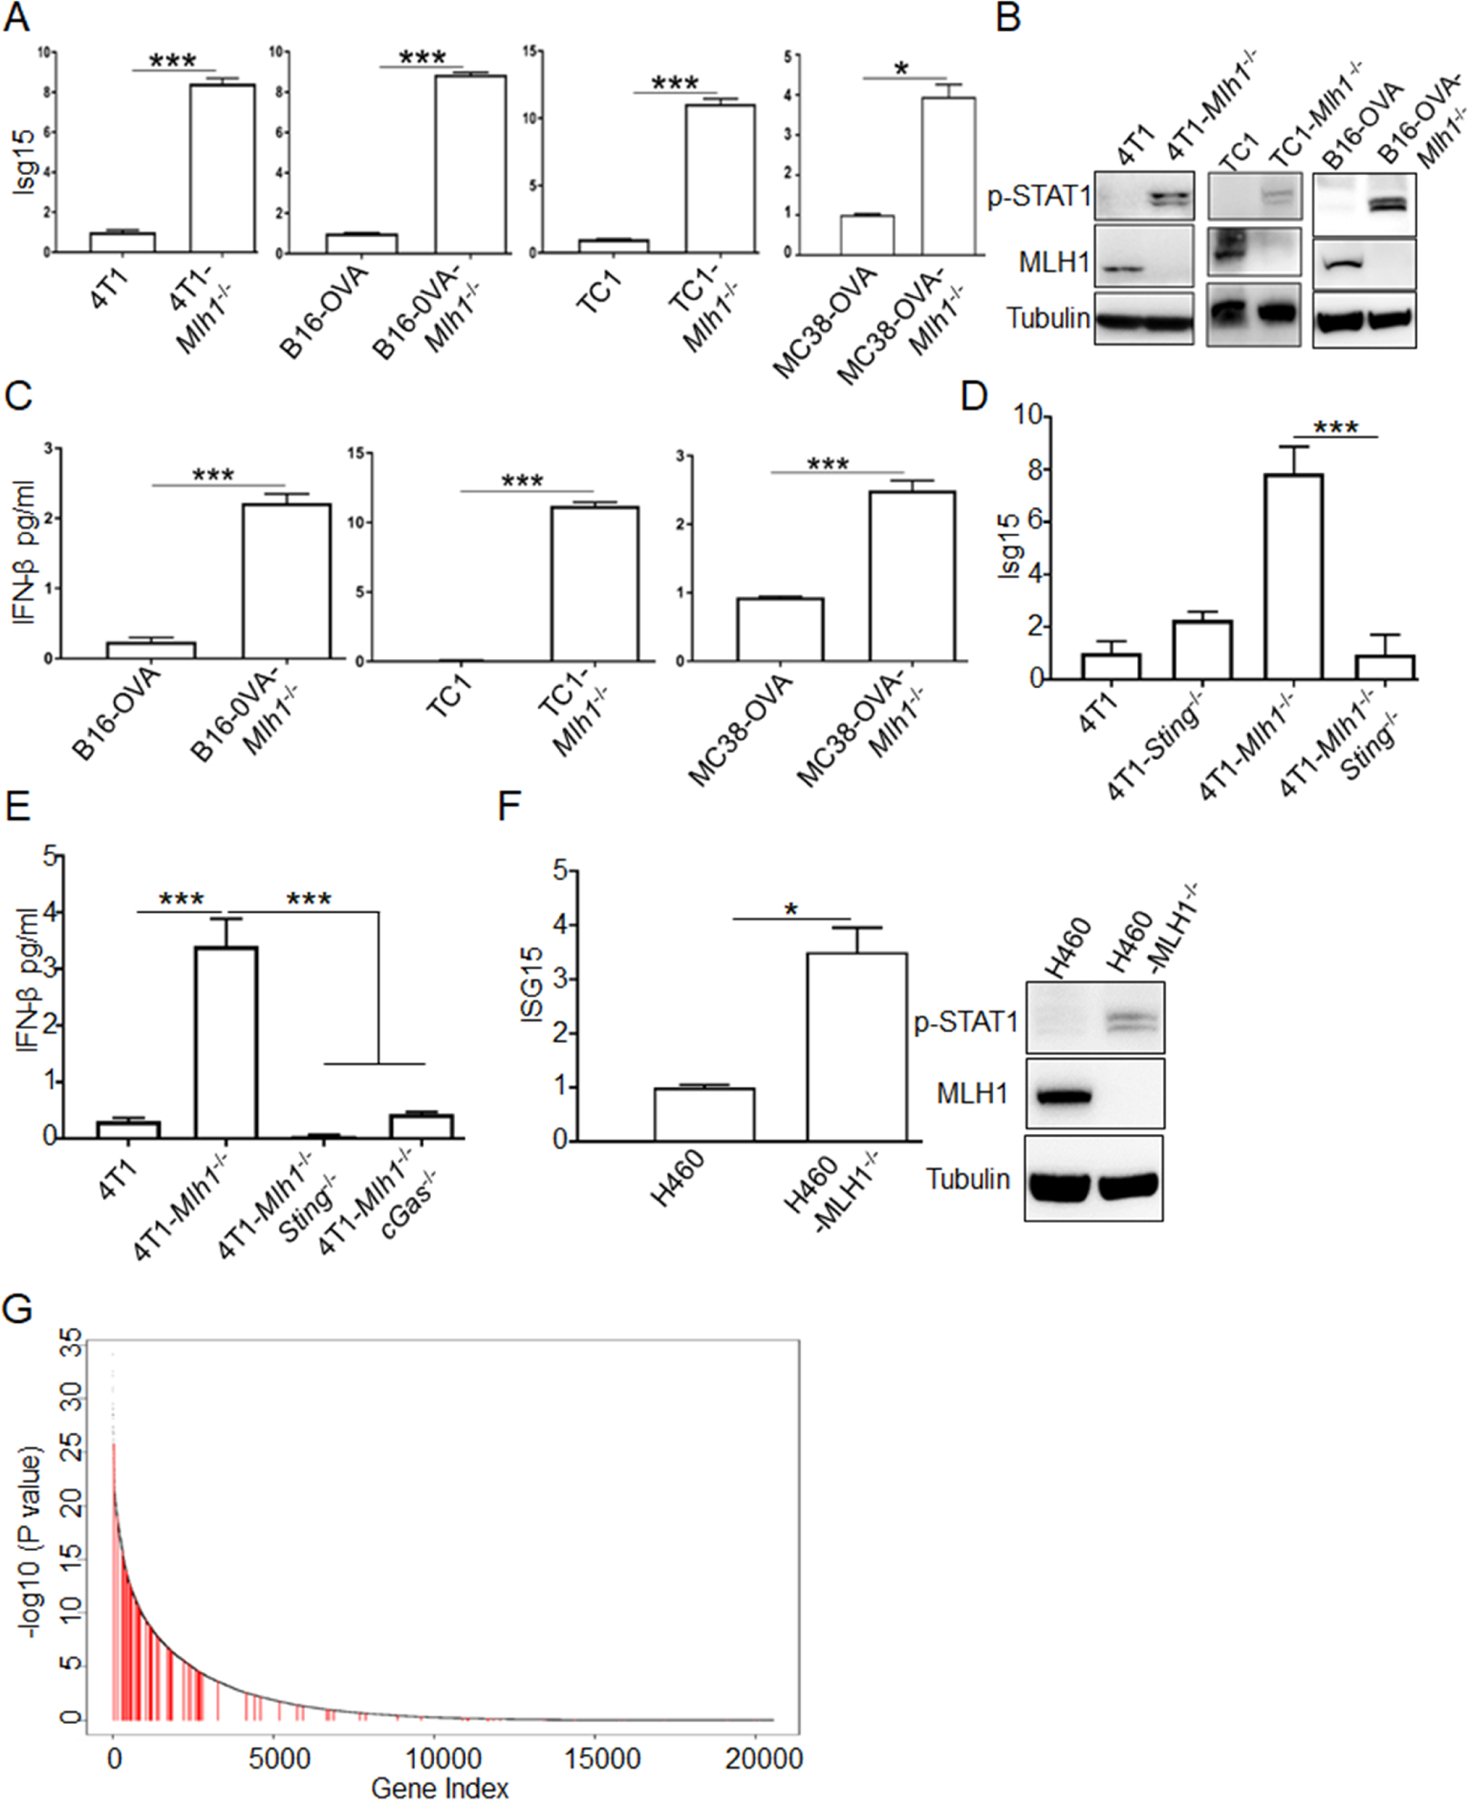
Figure 2. Type I IFN signal pathway is activated in dMLH1 tumor cells.

(A) ISGs expression at the mRNA level in cultured cells (n=3) was determined by qPCR. Relative expression fold change of representative ISG (Isg15) was shown. (also see Figure S2A).
(B) Phosphorylation of STAT1 at Y701 was shown by WB.
(C) IFN-β was quantified by ELISA in the supernatant of indicated cell lines (n=3).
(D and E) Isg15 and IFN-β were quantified by qPCR and ELISA, respectively, in Sting or cGAS-deficient cells lines (n=3).
(F) Isg15 and phosphorylation of STAT1 at Y701 were determined in H460 cells (n=3).
(G) The plot shows the ranked p values (-log10 scaled) estimated from Wilcoxon rank test comparing gene expression levels in MSI-H versus MSS colorectal tumors from the TCGA database. The test was one-sided, to test if genes in MSI-H are expressed at higher levels than in MSS tumors. Red vertical lines marked the type I IFN induced ISGs (see Table S1 for ISGs list and expression).
Data are represented as mean ± SEM. Representative data of over 2 independent experiments are shown. Unpaired t test was used to determine significance in A-F. Wilcoxon rank sum test was used to determine significance in G.
