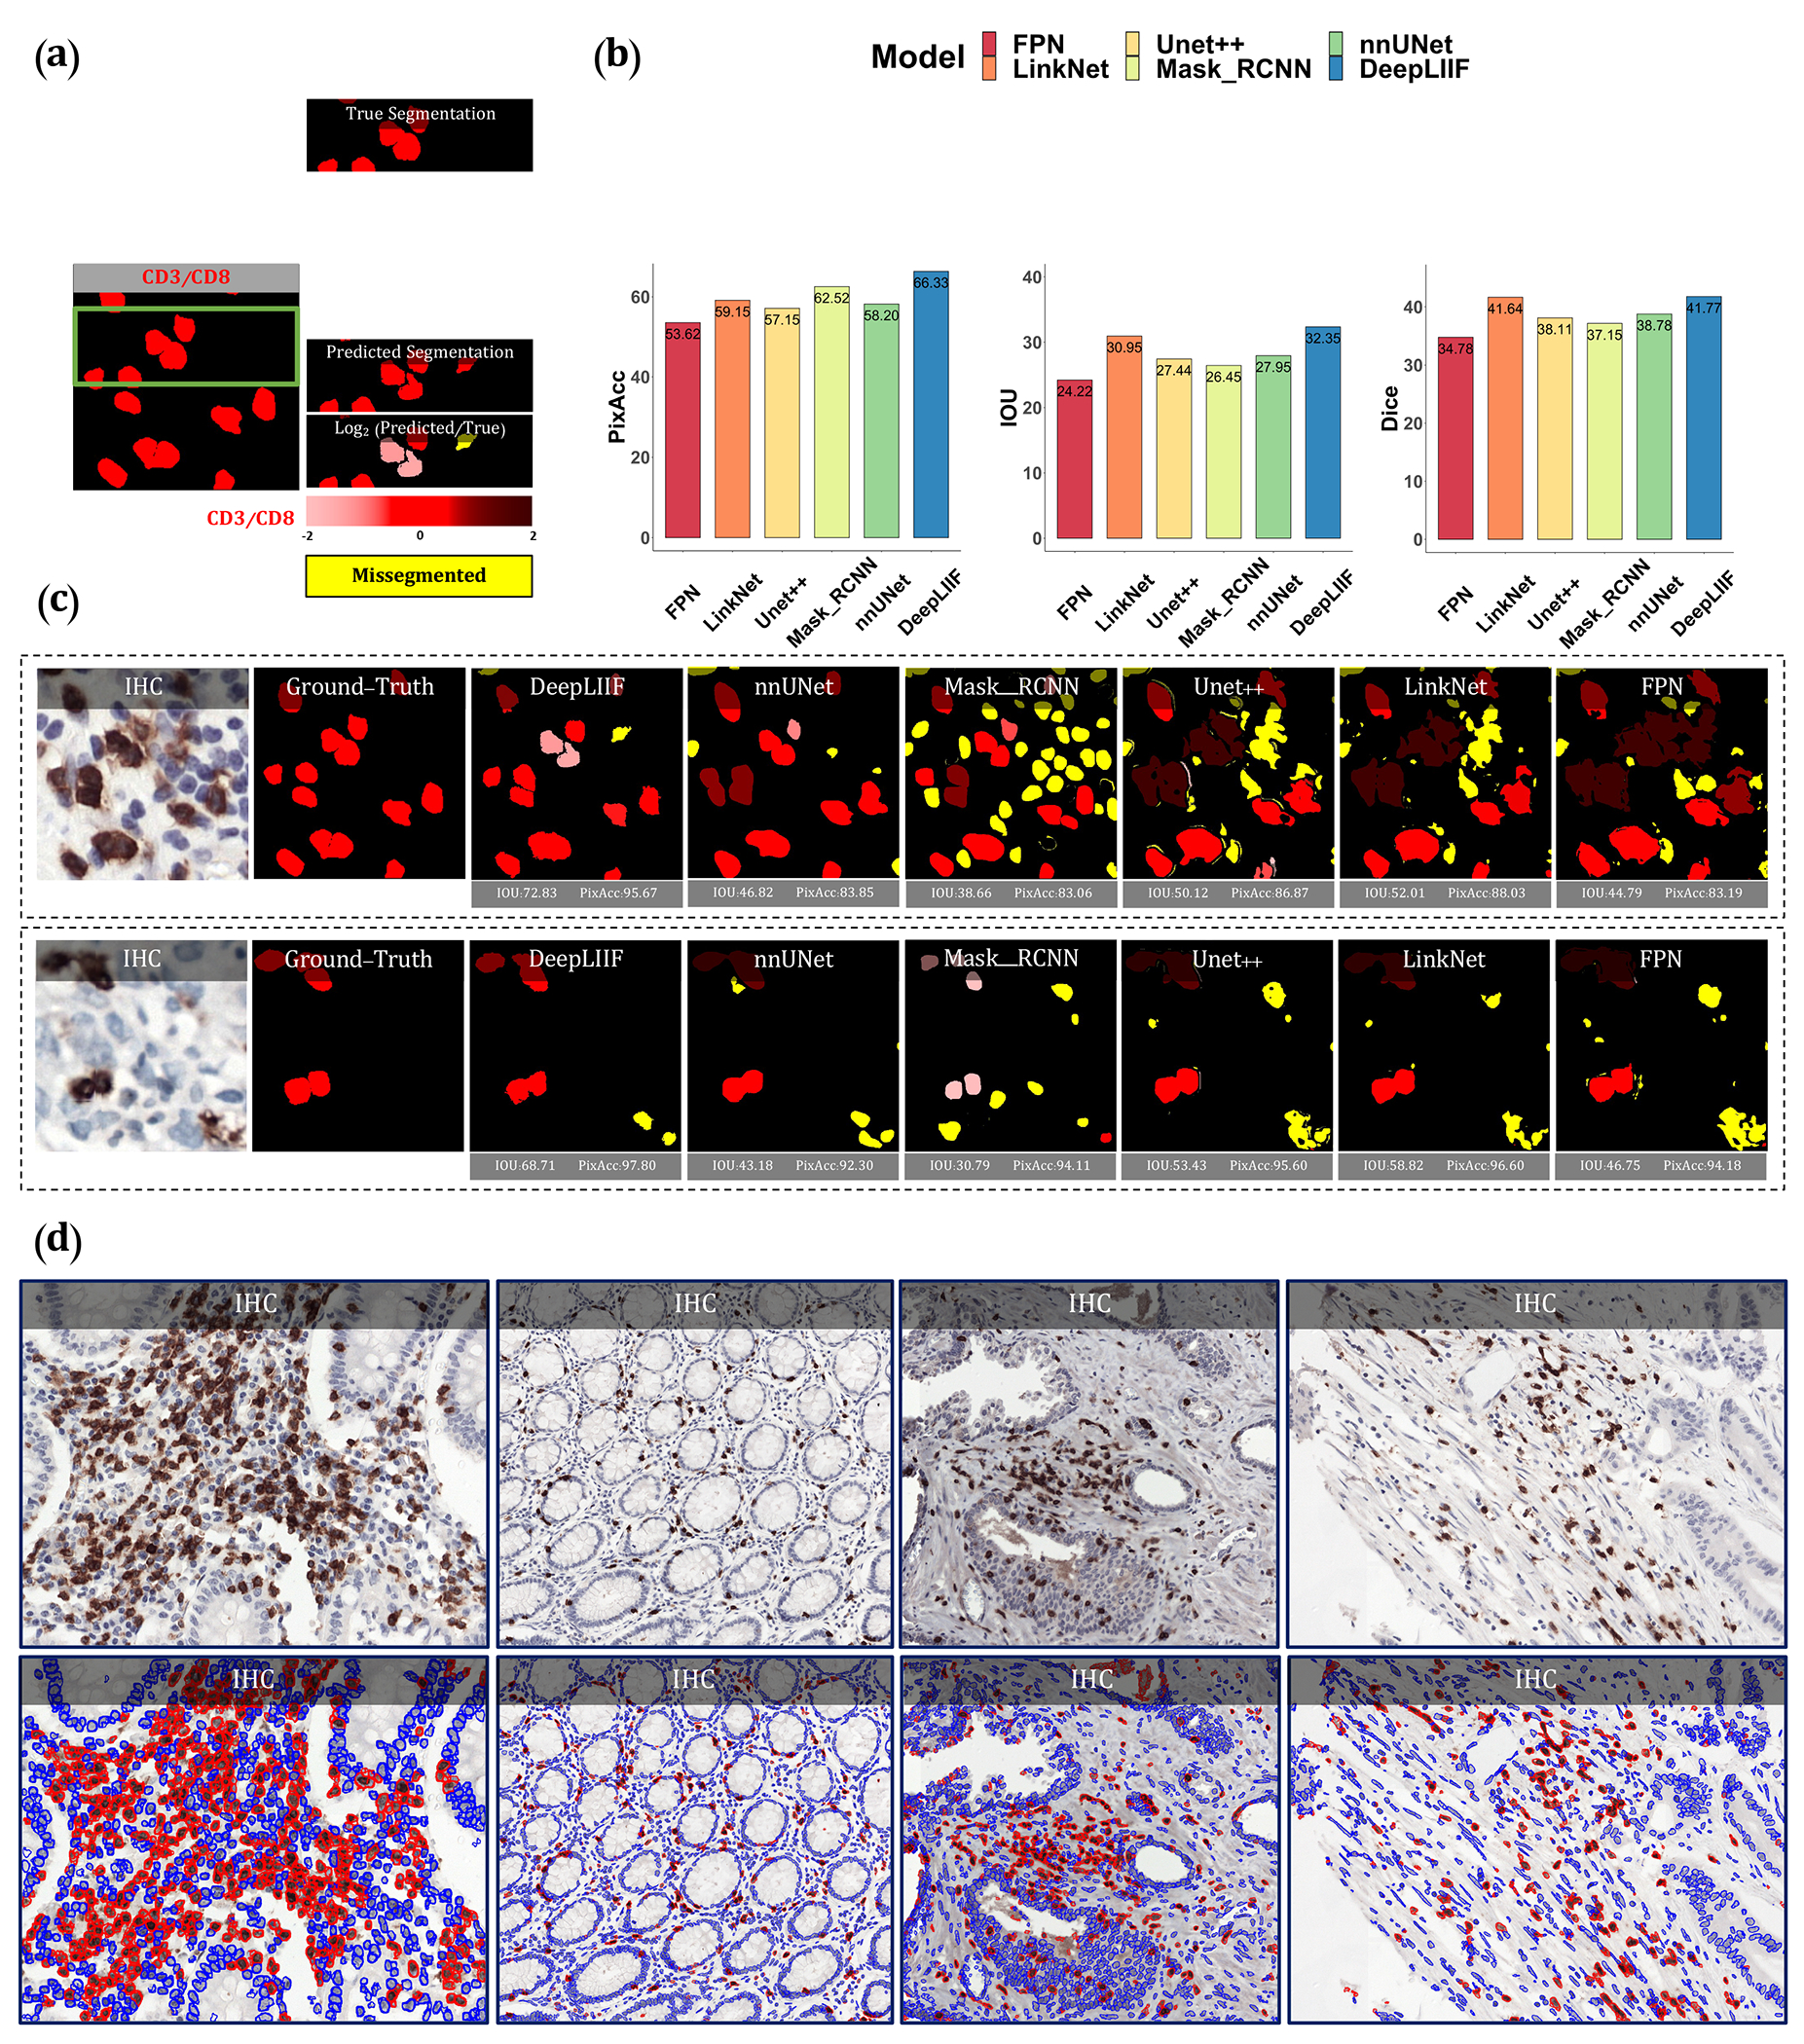
Figure 3.

Qualitative and quantitative analysis of DeepLIIF against state-of-the-art semantic segmentation models tested on NuClick Dataset (21) and four sample images from the LYON19 challenge dataset (11). (a) A segmentation mask showing CD3/CD8+ cells, along with a visual segmentation and classification accuracy. Predicted CD3/CD8+ cells are shown in red color, and the hue is set using the log2 of the ratio between the predicted area and ground-truth area. Cells with too large areas are shown in dark colors, and cells with too small areas are shown in a light color. For example, if the model correctly classifies a cell as CD3/CD8+, but the predicted cell area is too large, the cell is colored in dark red. If there is no cell in the ground-truth mask corresponding to a predicted cell, the predicted cell is shown in yellow, which means that the cell is missegmented (no corresponding ground-truth cell in the segmented cell area). (b) The accuracy of the segmentation and classification is measured by getting the average of Dice score, Pixel Accuracy, and IOU (intersection over union) between the predicted segmentation mask of CD3/CD8 and the ground-truth mask of the corresponding cells (0 indicates no agreement and 100 indicates perfect agreement). Evaluation of all scores shows that DeepLIIF outperforms all state-of-the-art models. (c) As mentioned earlier, DeepLIIF generalizes across different tissue types and imaging platforms. Two example images from the NuClick Dataset (21) along with the modalities and classified segmentation masks generated by DeepLIIF, are shown in the top rows where the ground-truth mask and quantitative segmentation masks of DeepLIIF and state-of-the-art models are shown in the second row. The mean IOU and Pixel Accuracy are given for each generated mask. (d) Randomly chosen samples from the LYON19 challenge dataset (11). The top row shows the IHC image, and the bottom row shows the classified segmentation mask generated by DeepLIIF. In the mask, the blue color shows the boundary of negative cells, and the red color shows the boundary of positive cells.
