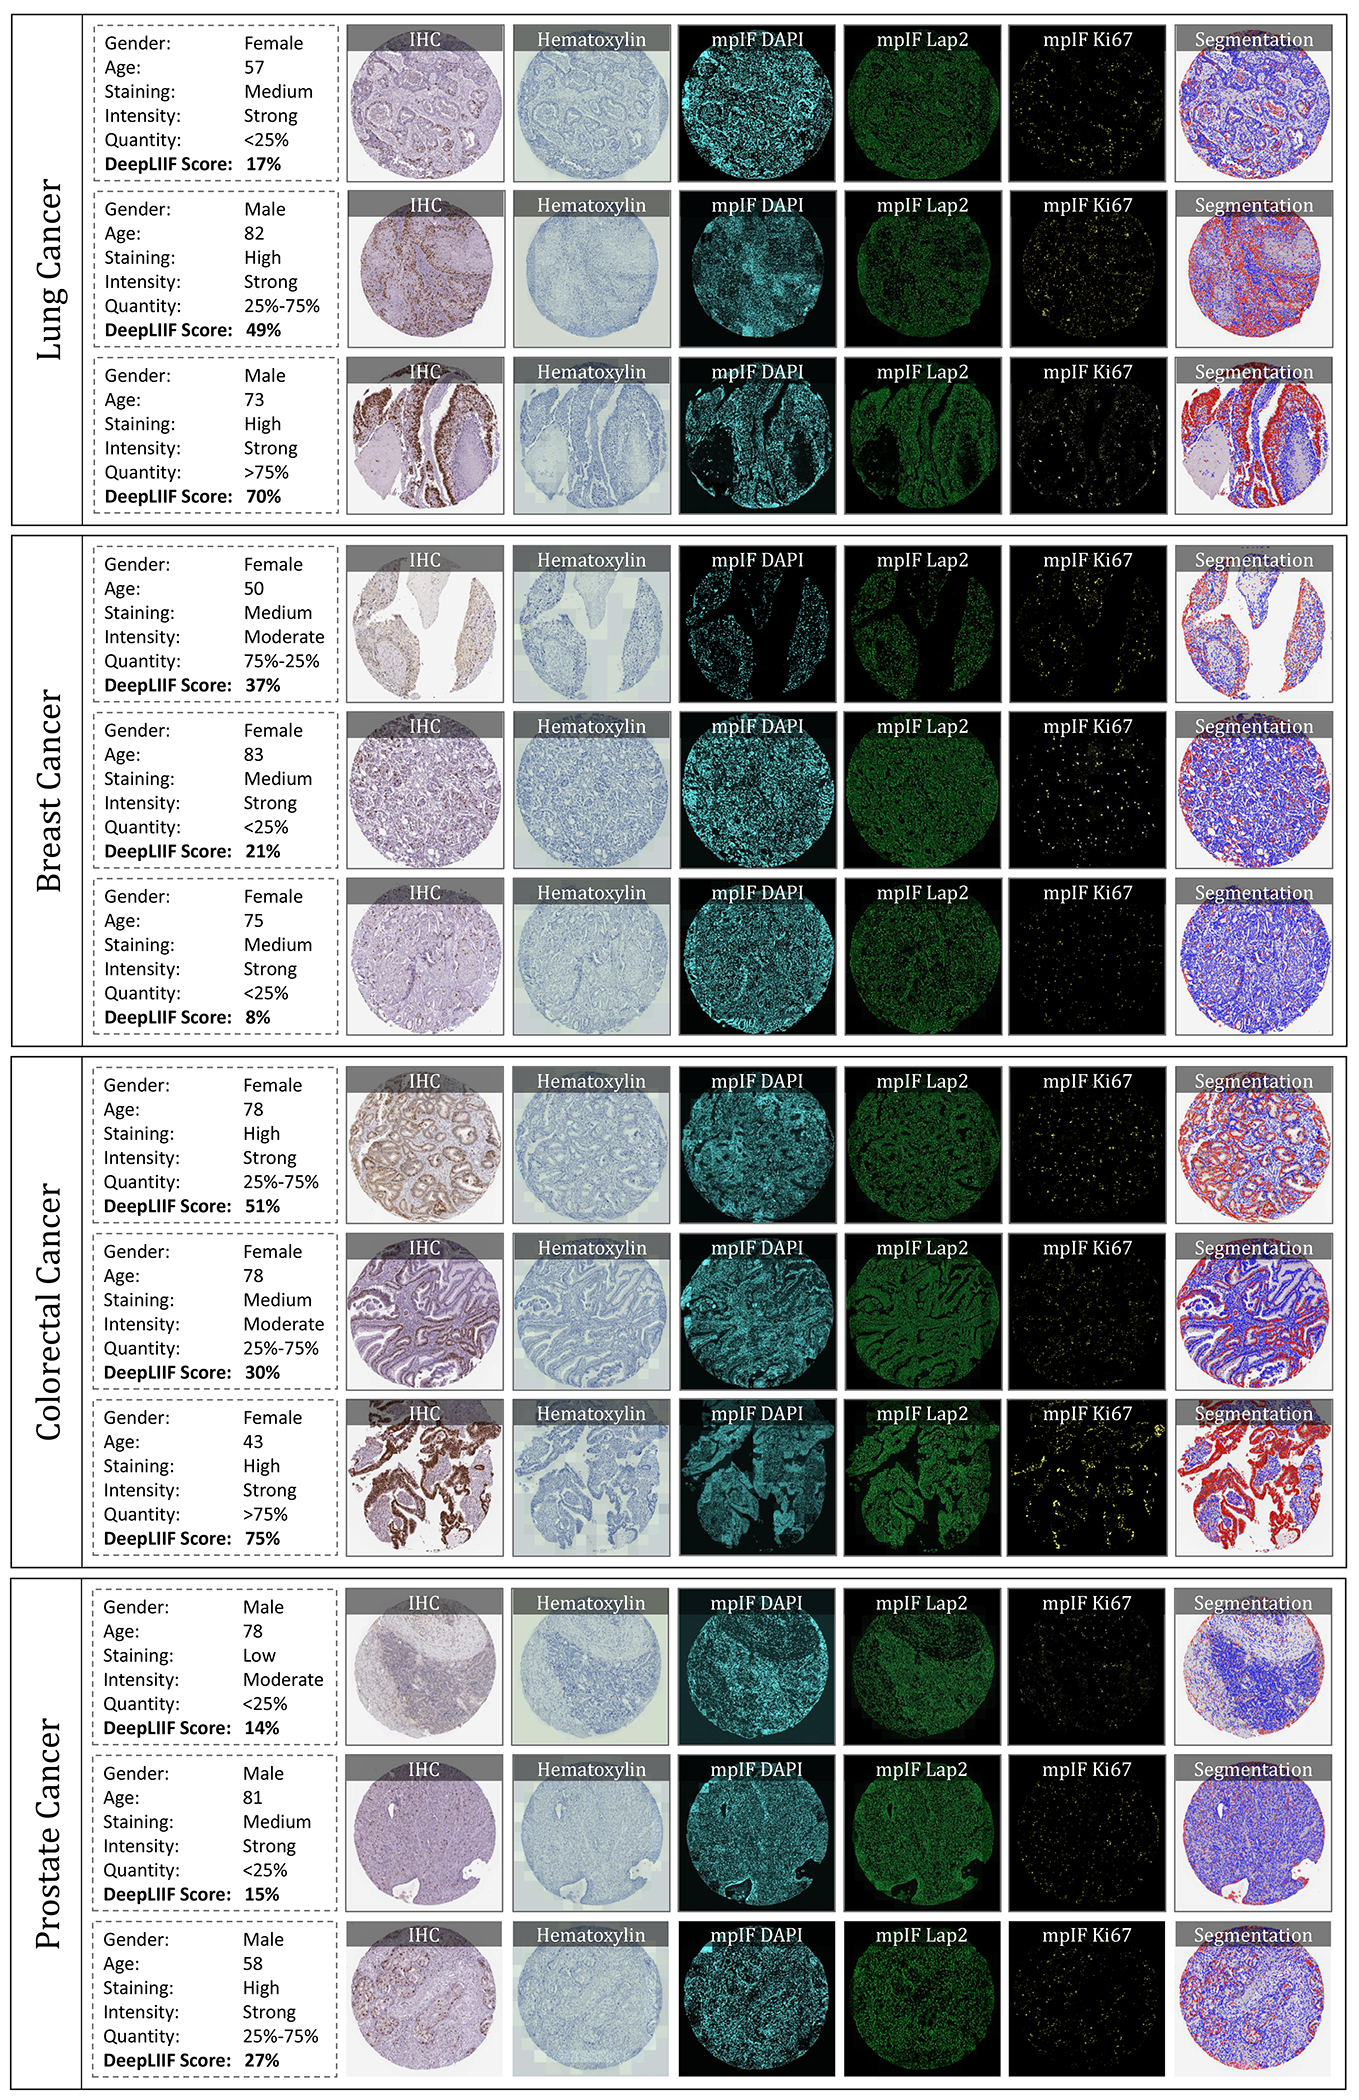
Figure 5.

IHC quantification of four cancer type images taken from Protein Atlas IHC Ki67 dataset. In each row, a sample is shown along with the inferred modalities and the classified segmentation mask. The demographic information of the patient and the details about the staining, along with the manual protein score and the predicted score by DeepLIIF are reported next to each sample.
