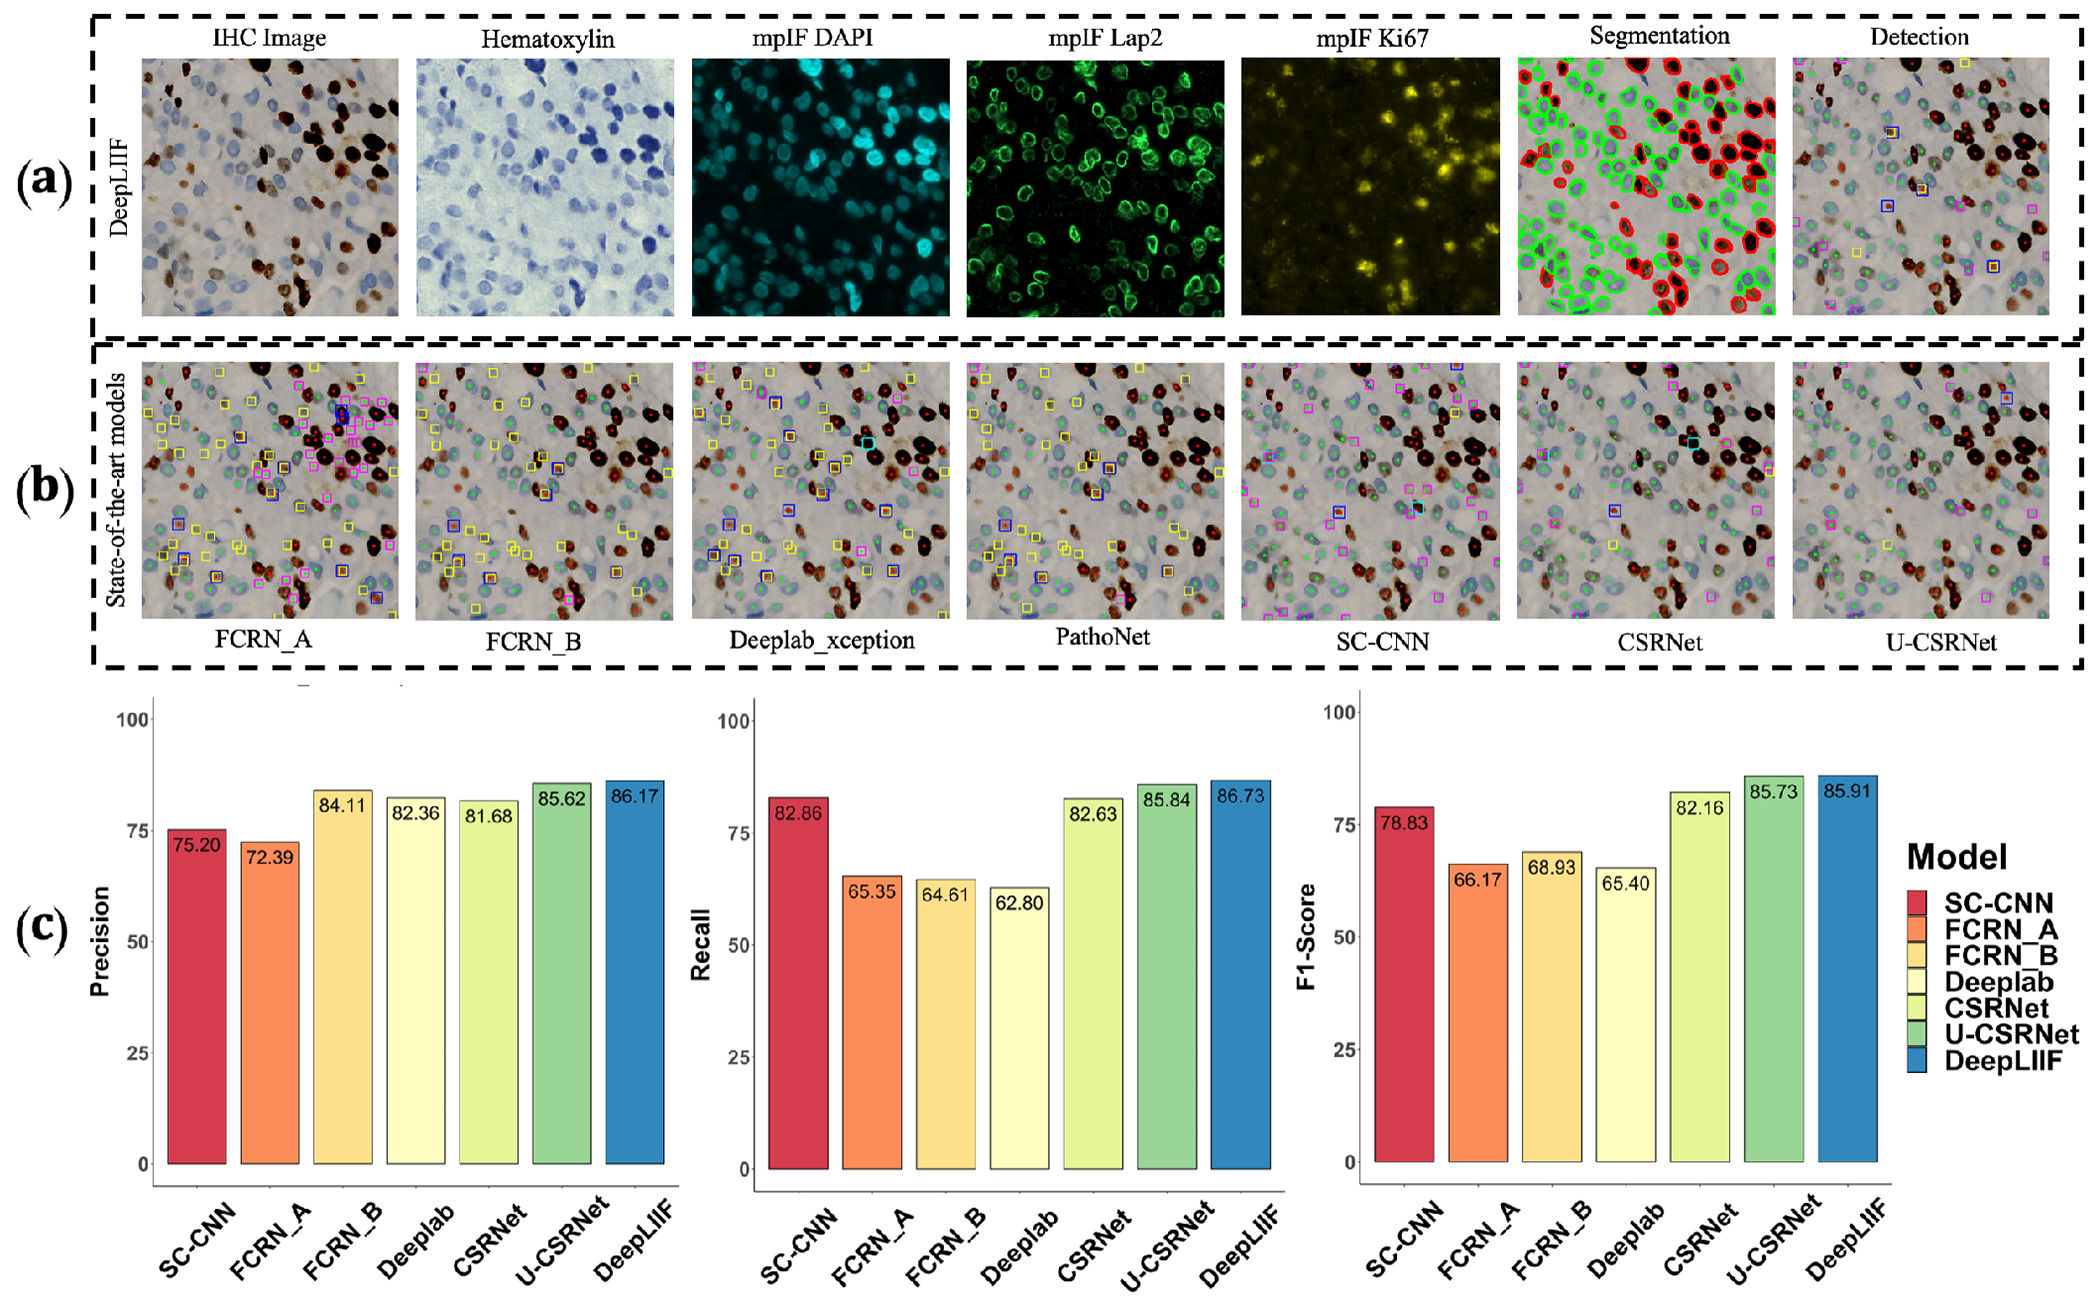
Extended Data Figure 1.

Qualitative and quantitative analysis of DeepLIIF against detection models on the testing set of the BC Data (9). (a) An example IHC image from the BC Data testing set, the generated modalities, segmentation mask overlaid on the IHC image, and the detection mask generated by DeepLIIF. (b) The detection masks generated by the detection models. In the detection mask, the center of a detected positive cell is shown with red dot and the center of a detected negative cell is shown with blue dot. We show the missing positive cells in cyan bounding boxes, the missing negative cells in yellow bounding boxes, the wrongly detected positive cells in blue bounding boxes, the wrongly detected negative cells in pink bounding boxes. (c) The detection accuracy is measured by getting average of precision , recall , and f1-score between the predicted detection mask of each class and the ground-truth mask of the corresponding class. A predicted point is regarded as true positive if it is within the region of a ground-truth point with a predefined radius (we set it to 10 pixels in our experiment which is similar to the predefined radius in (9)). Centers that have been detected more than once are considered as false positive. Evaluation of all scores show that DeepLIIF outperforms all state-of-the-art models.
