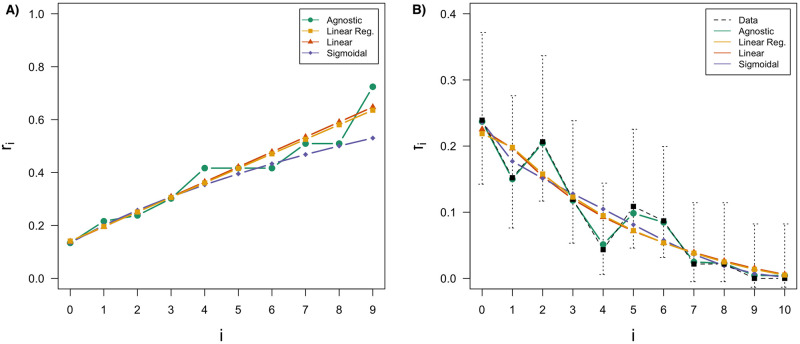
Fig 3. Single point estimation (parametrisation minimising the L2 distance between the rational functions and data).
(A). For comparison, rational function values (coloured lines), data (dashed line), and 90% confidence intervals computed from data points (black error bars) (B). On each graph, the results are shown for the agnostic model (green), a linear regression on the agnostic points (yellow), the linear model (red) and the sigmoidal model (blue).

