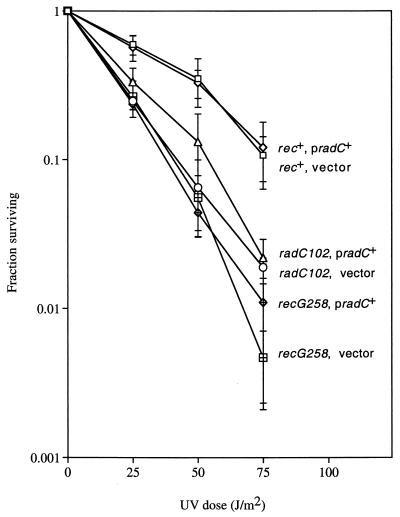
FIG. 3.
Effect of pradC+ on UV sensitivity. Values are averages from one experiment with three independent cultures of each strain. The error bars represent one standard deviation. Within each set of strains (rec+, radC, and recG258), the error bars are overlapping, with the exception of the radC102 set at the 25 J/m2 dose. Similar results were obtained in a second experiment (data not shown). The strains used are (from top to bottom) SMR5678, SMR5677, SMR5682, SMR5681, SMR5686, and SMR5685.

