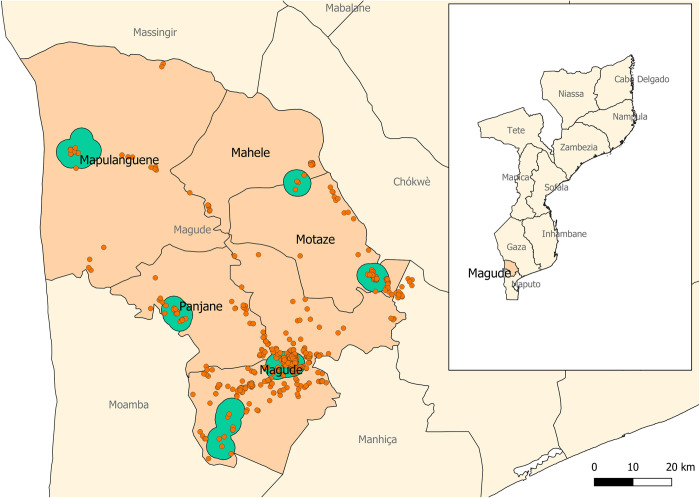
Fig 1. Map of Magude district.
Red dots represent the households that were enrolled in the human behavioral study; the green areas are areas where entomological surveillance was conducted. The subnational administrative boundaries have been taken from the Humanitarian Data Exchange (https://data.humdata.org/dataset/cod-ab-moz) under a CC-BY-IGO license (https://data.humdata.org/faqs/licenses).

