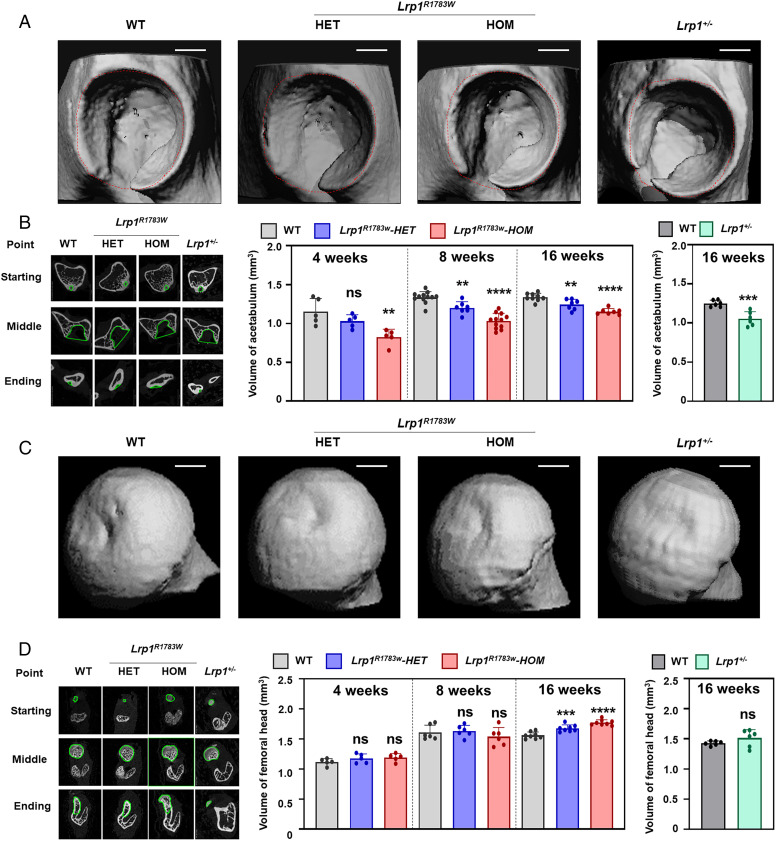
Fig. 1.
3D micro-CT images of the DDH phenotype of heterozygous and homozygous Lrp1R1783W mice, Lrp1+/− mice, and their WT littermates at 8 wk. (A) Micro-CT images of the acetabulum. (B) The volume of the acetabulum measured according to the ROI. (C) Micro-CT images of the femoral head. (D) The volume of the femoral head. Volumes were measured according to the ROI. Scale bar: 1 mm. Values = means ± SD; ns, not significant; **P < 0.01; ***P < 0.001; ****P < 0.0001; HET, heterozygote; HOM, homozygote.

