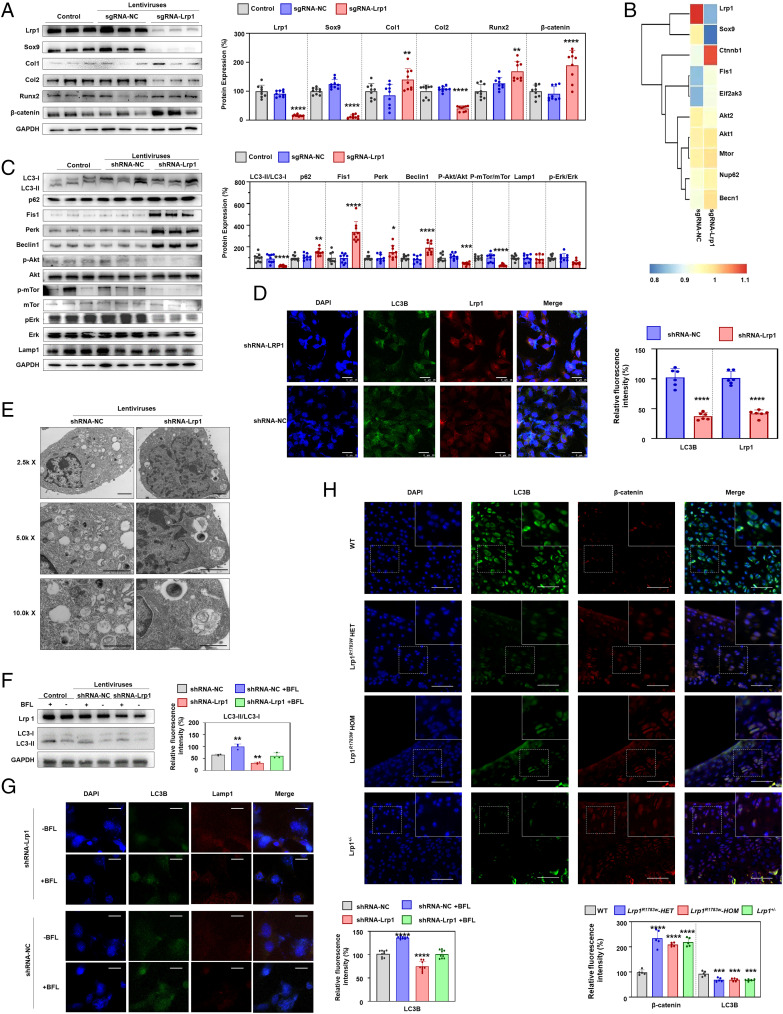
Fig. 4.
Lrp1 knockdown reduces chondrogenic differentiation in ATDC5 cells. (A) Western blot for LRP1 and chondrogenic differentiation markers. The relative protein level was determined by density analysis. Results of three independent experiments (n = 9). Values = means ± SD; *P < 0.05; **P < 0.01; ****P < 0.0001. (B) Heatmaps of a protein mass spectrometry analysis of ATDC5 cells after chondrogenic induction for 7 d. (C) Western blot for autophagy-related proteins. (D) Electron micrographs showing the level of autophagy in ATDC5 cells transfected with shRNA-Lrp1 and shRNA-NC lentiviruses. Fewer autophagosomes were observed in the shRNA-Lrp1 group. Scale bar: 2 μm. (E) Immunohistochemistry staining of Lrp1 and LC3B in ATDC5 cells with shRNA-Lrp1 lentivirus transfection. The histological scoring system showed a decrease of LC3B in Lrp1 knockdown. (F) After treatment with BFL-A1, the shRNA-Lrp1 lentivirus transfection group untreated with BFL-A1 showed the lowest level of LC3II. The difference value of the LC3II level between the shRNA-NC with BFL group and the shRNA-NC without BFL group was not significant compared with the difference value of the LC3II level between the shRNA-NC with BFL group and the shRNA-Lrp1 with BFL group. (G) Immunofluorescence staining for autophagosome and lysosome location. LC3B-II puncta, green; LAMP2 puncta, red; DAPI, blue. Scale bar: 15 μm. (H) Immunohistochemistry staining of the hip sections showed increased β-catenin and decreased LC3B in heterozygous and homozygous Lrp1 R1783W mice, Lrp1+/− mice, and their WT littermates.

