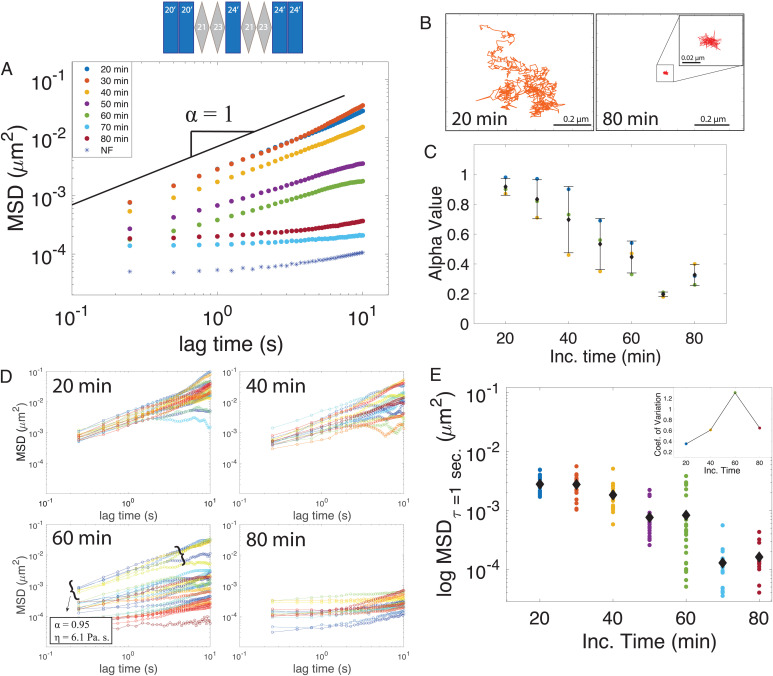
Fig. 4.
Rheological signatures accompanying elastin maturation. (A) Average MSD of bead particle vs. lag time within liquid droplets at increasing incubation times. The noise floor (NF) of the instrument is plotted as blue asterisks. The α-value represents the diffusive exponent, and the black solid line represents a slope of one. (B) Single-bead trajectories inside the minielastin condensate at 20 and 80 min of incubation time. Inset, zoomed in trajectory at 80 min. (C) Decreasing diffusive exponent (α) values among three individual experiments as a function of time. (D) Individual bead tracks vs. lag times at increasing incubation times of 20, 40, 60, and 80 min of incubation. (E) Black diamonds represent the average of individual MSD trajectories at increasing incubation times, with the spread of trajectories represented as scatter points at a lag time (τ) of 1 s. (Inset) Coefficient of variation among tracks at a lag time (τ) of 1 s.

