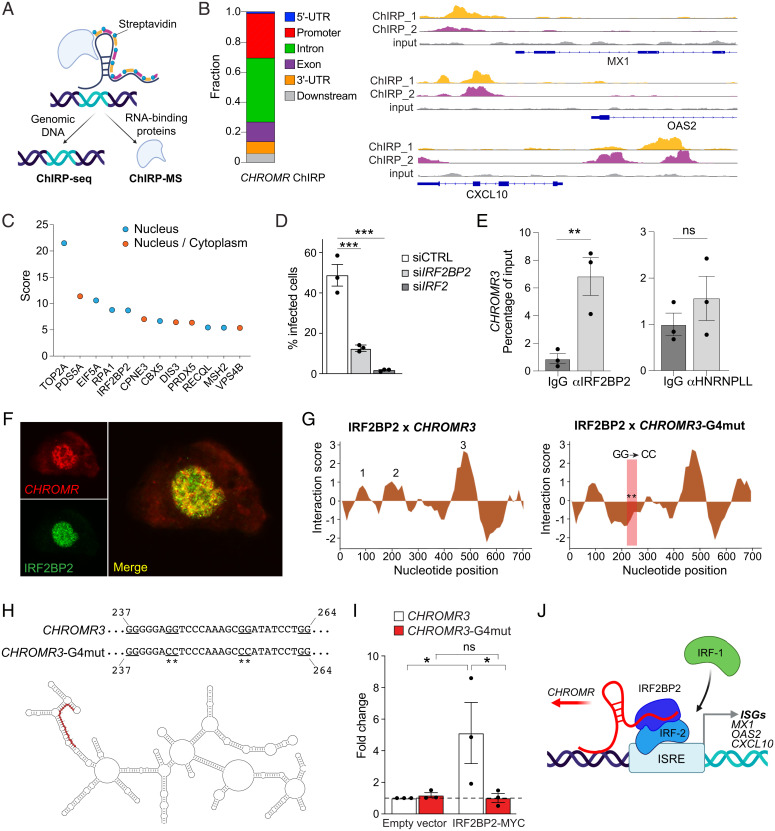
Fig. 4.
CHROMR binds to IRF2BP2 to control interferon-stimulated gene expression. (A) Schematic representation of ChIRP followed by genomic DNA sequencing (ChIRP-Seq) or mass spectrometry (ChIRP-MS) to identify RNA-binding proteins. (B) Distribution of CHROMR binding sites within ISG loci (Left) and representative ChIRP-seq reads (Top: “even” probe set [ChIRP_1]; Middle: “odd” probe set [ChIRP_2]; Bottom: input) at selected ISG promoters (Right). UTR, untranslated region. (C) Nuclear CHROMR-binding proteins identified by ChIRP-MS in THP-1 macrophages from three independent experiments. (D) Percentage of cells infected with IAV/WSN/1933 (H1N1, 1,000 PFU) in THP-1 macrophages transfected with siRNAs against IRF2BP2, IRF2, or a nontargeting siRNA control (siCTRL). (E) qPCR analysis of CHROMR3 in RNA immunocomplexes precipitated from THP-1 macrophages with IRF2BP2 or HNRNPLL antibodies or IgG as a control. (F) Representative microscopic image of RNA fluorescence in situ hybridization staining for CHROMR (red) in combination with immunofluorescent staining for IRF2BP2 in THP-1 macrophages. Merged image indicates signal colocalization (yellow). (G) catRAPID predicted interaction profile of IRF2BP2 with CHROMR3 or CHROMR3-G4 mutant (position of mutation indicated by ** in boxed region). (H) Visualization of CHROMR3 secondary structure in RNArtist, with the putative IRF2BP2–G-quadruplex interaction domain highlighted in red (Bottom). Site-directed mutation of the putative G-quadruplex (underlined) in CHROMR3 (Top). (I) Relative enrichment of CHROMR3 or CHROMR3-G4mut in MYC-IRF2BP2 immunoprecipitates. (J) Integrated model depicting CHROMR binding to IRF2BP2 to sequester the IRF-2 repressor complex from ISREs, facilitating access for activating interferon regulatory factors (e.g., IRF-1). (E and I) Data are relative to IgG control; mean ± SE of three independent experiments. P values were calculated via one-way ANOVA with Dunnett’s multiple comparison test (D and I) or a repeated-measures two-way ANOVA with Sidak’s multiple comparison test (E). *P ≤ 0.05; **P < 0.01; ***P < 0.001.

