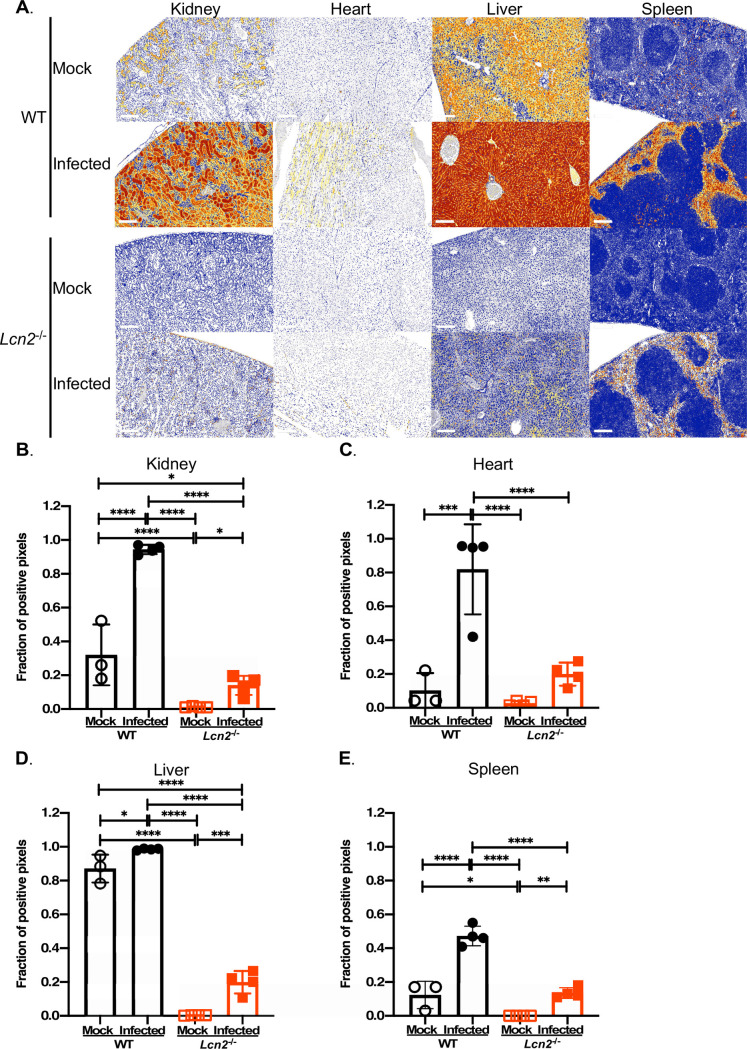
Fig 3. LCN2 is expressed in the A. baumannii infected host.
WT or Lcn2-/- knockout mice were infected systemically with WT A. baumannii or mock-infected with sterile PBS. After 24 h, the mice were humanely euthanized, the organs were harvested and subsequently fixed using 10% neutral buffered formalin. Tissues were sectioned and LCN2 was detected using polyclonal goat ɑ-mouse LCN2 antibody and ɑ-goat IgG. Immunolabeling was detected with 3,3’-diaminobenzidine (DAB) and slides were counterstained with stained with hematoxylin. Whole slide images were false-colored to represent four expression levels for LCN2, as indicated by the legend (0+ blue, 1+ yellow, 2+ orange, 3+ red) (A). Representative photomicrographs from three mice per group are shown. The scale bar represents 200 μM. Digital tissue image analyses were performed to determine the fraction of LCN2 positive pixels relative to total pixels in the whole tissue section (B-E). Each symbol represents data collected from an individual mouse. Statistical analysis was performed by one-way ANOVA using Holm-Sidak’s multiple comparisons post-test where *p < 0.05, ** p < 0.01, *** p < 0.001 and **** p < 0.0001.

