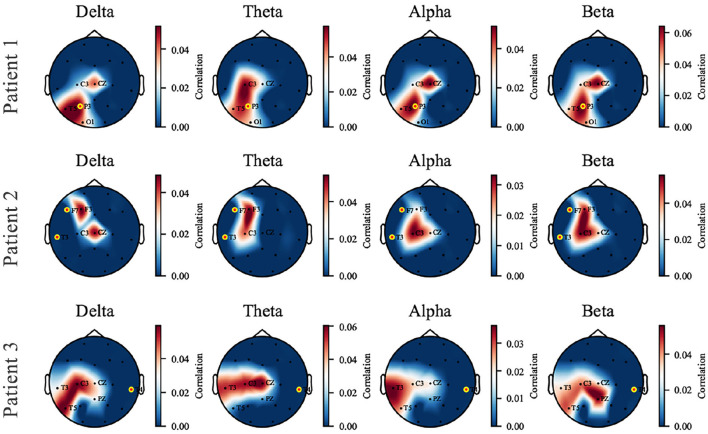
Figure 6.
The topological map of correlation coefficient from input-signal perturbation where red indicates a high correlation and blue indicates a low correlation. Four bands (δ, θ, α, and β) are investigated on each patient, and three of them are displayed as representatives. The names of available EEG channels for each patient are listed, and the channels nearby a seizure focus are marked with yellow-edged dots. Patients 1 and 2 are good examples that the sensitive zone (left parietal and temporal zone for Patient 1, left frontal and temporal for Patient 2) coincides with the seizure location, while Patient 3 is an exceptional case due to the missing of T4 channel in the dataset.

