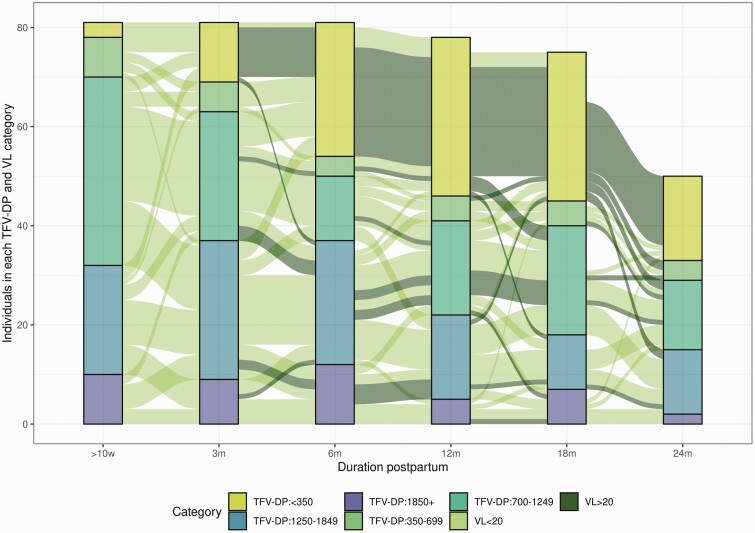
Figure 2.
HIV VL and TFV-DP trajectories over the study period (n = 81). The colored bars represent the proportion of individuals in each TFV-DP concentration category at each time point. The lines (paths) between the bars are colored by VL category and show the trajectory of TFV-DP concentrations over time. Abbreviations: HIV, human immunodeficiency virus; m, months; TFV-DP, tenofovir diphosphate; VL, viral load; w, weeks.

