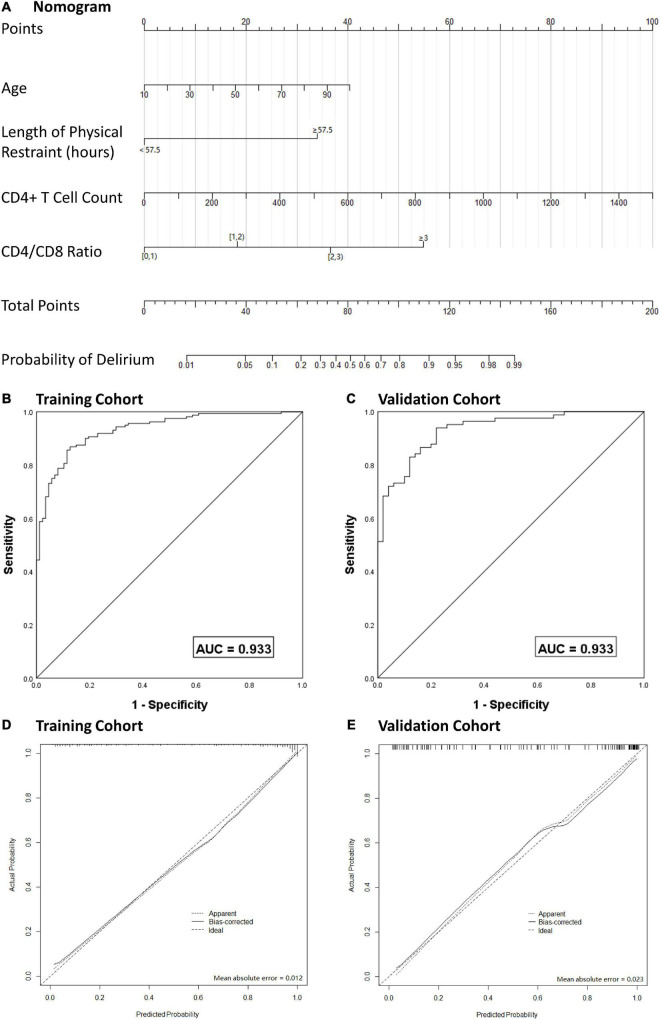
FIGURE 4.
Nomogram model for the prediction of individual delirium risk in critical ill patients undergoing cardiac surgery, (A) nomogram for delirium risk. A comparison of area under the receiver operating characteristic curve (AUROC) values for the prediction of delirium in the training cohort (B) and validation cohort (C). Calibration curves for nomogram-based assessments of the training cohort (D) and validation cohort (E). CD4/CD8, CD4 + T cell count over CD8 + T cell count; AUC, area under curve.

