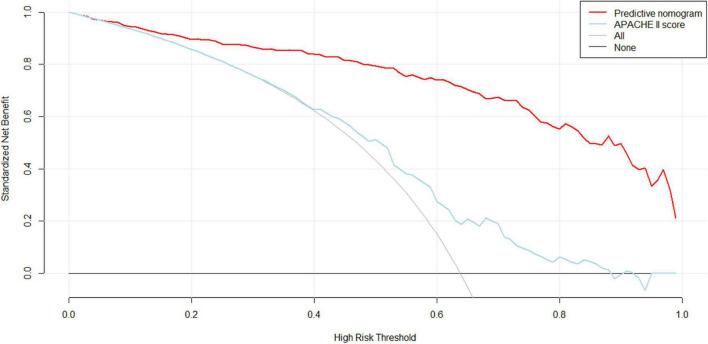
FIGURE 5.
Decision curve analysis (DCA) of the nomogram. X-axis and y-axis represent threshold probability and net benefit, respectively. For the clinical utility of the nomogram as a diagnostic model for delirium, the net benefit curve is shown in the DCA. When the threshold value of the diagnostic model is between 0.30 and 0.99, the patients will obtain the corresponding net benefit as long as the therapeutic measure is taken.

