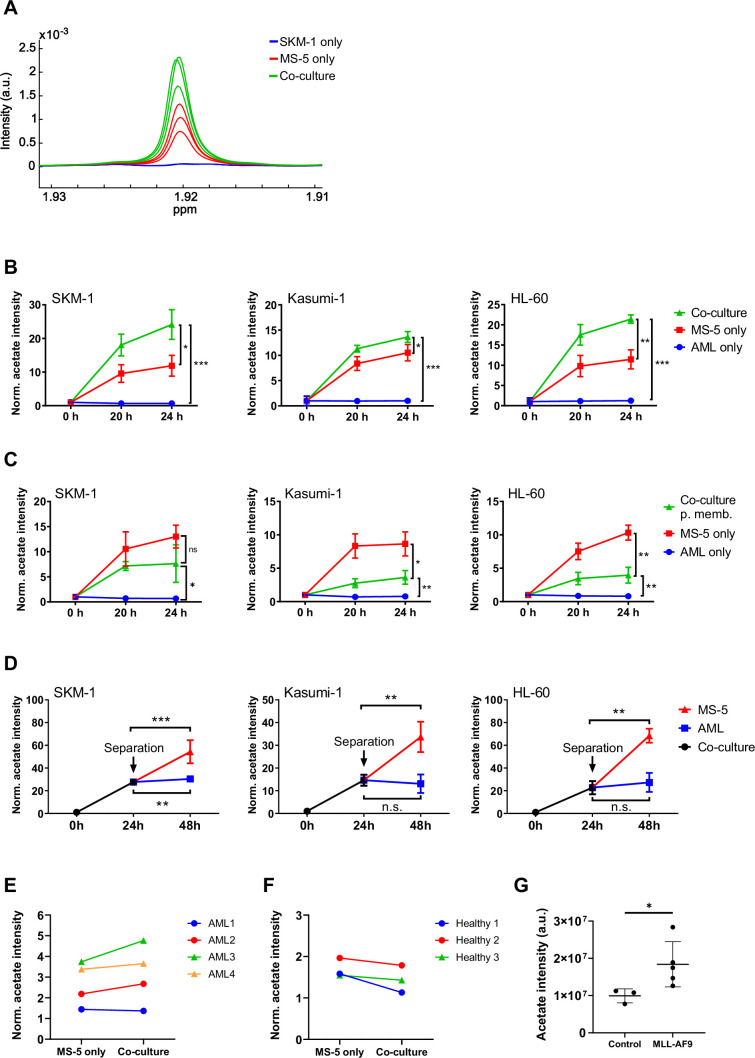
Figure 1. Acetate secretion by stromal cells increases in AML-stroma co-cultures of several AML cell lines and primary AML cells in direct contact.
(A) Section of 1H-NMR spectra, corresponding to the methyl group of acetate, from extracellular medium samples of SKM-1 cells cultured alone (blue), MS-5 cells cultured alone (red) and SKM-1 and MS-5 cells in co-culture (green) after 24 hours. (B) Extracellular acetate levels in AML cell lines (SKM-1, Kasumi-1 and HL-60) cultured alone (blue), MS-5 cells cultured alone (red) and AML and MS-5 cells in co-culture in direct contact (green) at 0, 20 and 24 hours of incubation. Each point represents the mean of n=3 independent experiments and error bars represent standard deviations. (C) Extracellular acetate levels in AML cell lines cultured alone (blue), MS-5 cells cultured alone (red) and AML and MS-5 cells in co-culture separated by a 0.4 µm permeable membrane (green) at 0, 20, and 24 hr of incubation. Each point represents the mean of n=3 independent experiments and error bars represent standard deviations. (D) Extracellular acetate levels in AML cell lines and MS-5 cells in co-culture (black) for 24 hr and after being separated and cultured alone in the same medium until 48 hr (blue for AML and red for MS-5). Each point represents the mean of n=3 independent experiments and error bars represent standard deviations. (E) Extracellular acetate levels in MS-5 cells cultured alone and primary patient-derived AML cells co-cultured with MS-5 cells at 48 hr. Each set of points represents an independent experiment (n=4). (F) Extracellular acetate levels in MS-5 cells cultured alone and healthy donor-derived peripheral blood mononuclear CD34+ (PBMC) cells co-cultured with MS-5 cells at 48 hr. Each set of points represents an independent experiment (n=3). For E and F, symbols (circles or triangles) indicate same cell culture medium composition was used. (G), Acetate levels in bone marrow extracellular fluid of C57BL6/J mice 6 months after transplantation with bone marrow nucleated cells isolated from control or MLL-AF9 transgenic mice. For B, C, and D unpaired Student’s t-tests were applied for each condition (black brackets) for G a Mann-Whitney test was applied (black brackets). p-values are represented by n.s. for not significant * for p-value <0.05, ** for p-value <0.01 and *** for p-value <0.001.
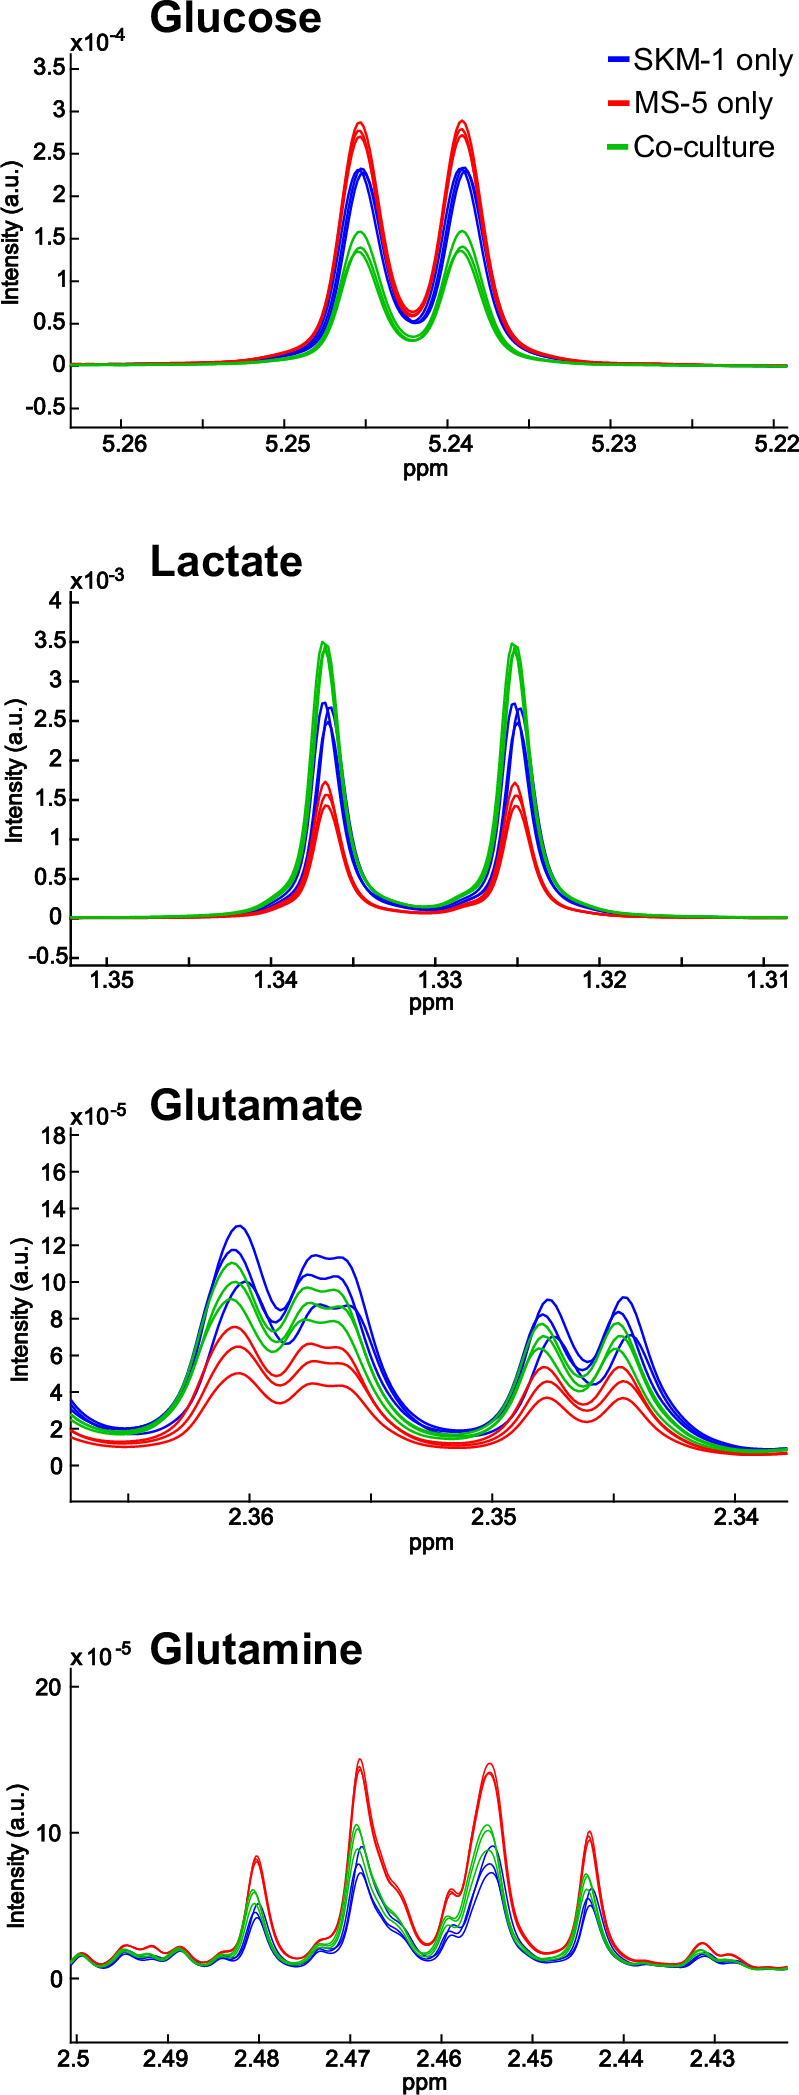
Figure 1—figure supplement 1. Other extracellular metabolite levels in co-cultures with SKM-1 and MS-5 cells.


