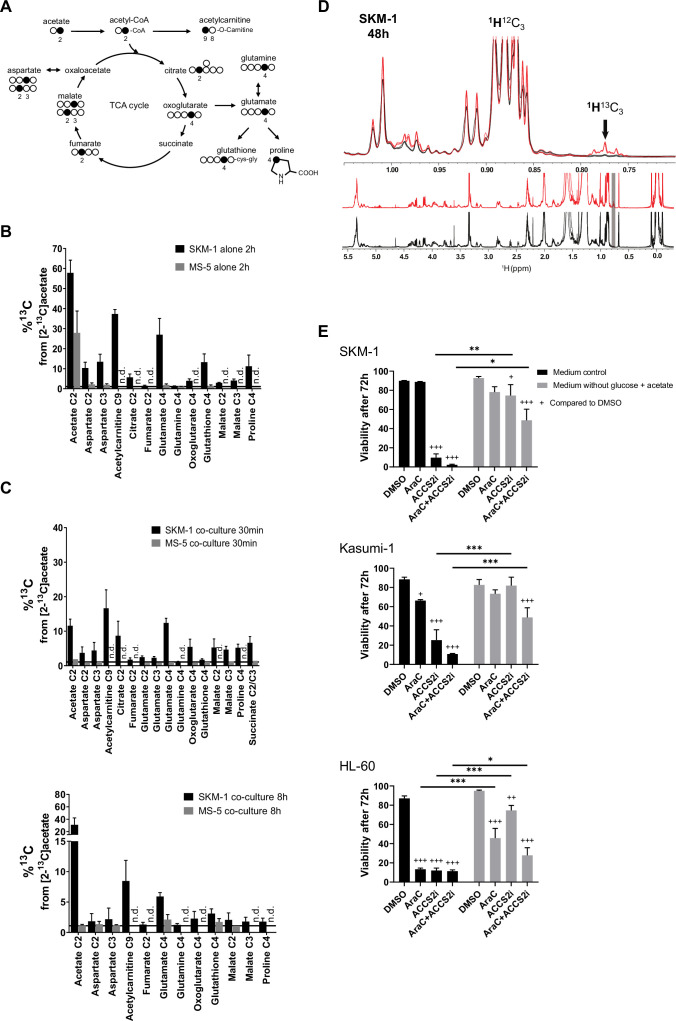
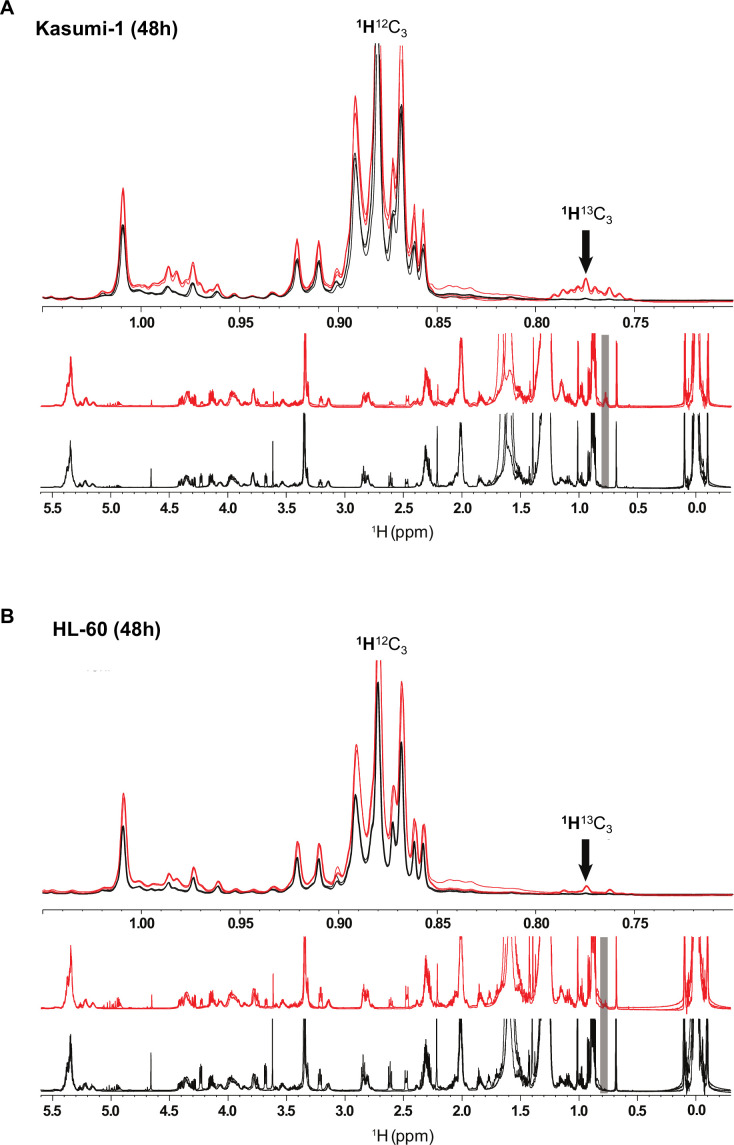
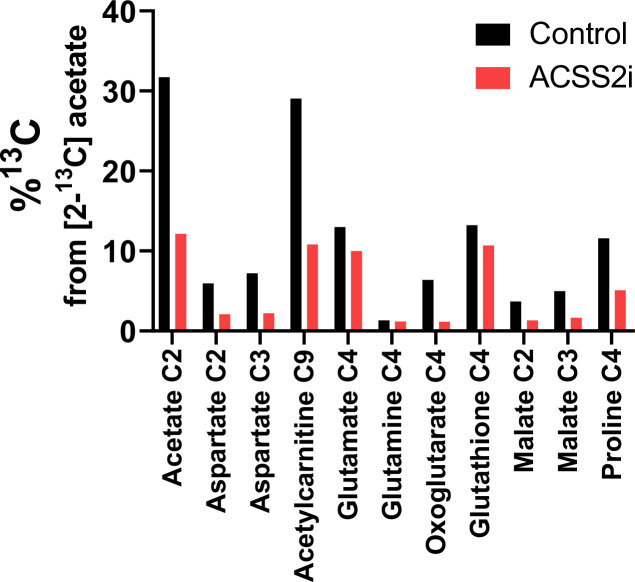
Figure 2. AML cells can import the secreted acetate in co-culture to use it in TCA cycle and lipid biogenesis.
(A) Schematic of label distribution arising from [2-13C]acetate in TCA cycle intermediates. Black circles correspond to positions expected to be labelled. (B) 13C percentages of label incorporation in polar metabolites from labelled acetate in SKM-1 and MS-5 cells after two hours of incubation with [2-13C]acetate (4 mM) derived from 1H-13C-HSQC NMR spectra. Bars represent the mean of the 13C percentages and error bars represent the standard deviations for n=3 independent experiments. (C) 13C percentages on polar metabolites in SKM-1 and MS-5 cells in co-culture. Cells were co-cultured for 24 hr before the addition of extra 4 mM sodium [2-13C]acetate and culture for additional 30 min (upper panel) or 8 hr (lower panel). Bars represent the mean of the 13C percentages and error bars represent the standard deviations of n=3 independent experiments. 13C natural abundance is represented as a black bar at %13C=1.1. (D) 1H 1D NMR of lipids extracted from SKM-1 cells. Cells were co-cultured with MS-5 cells for 24 hr before the addition of extra 4 mM sodium [2-13C]acetate and culture for additional 48 hr. Lower panel represents overlay of spectra (n=3) from cells grown in 12C- and 13C—labelled acetate (black and red, respectively). Upper panel is the zoomed section of the spectra show 1H13C-methyl signal multiplets at 1.05ppm to 0.7pm as indicated by an arrow (the shift of the 1H13C methyl satellite signal is caused by the scalar JCH coupling of 125–128 Hz). (E) Cell viability measured by propidium iodide staining after culturing for 72 hr in glucose-free media containing 4 mM acetate or normal media, in the presence of DMSO, AraC 1 µM, and ACSS2i 20 uM. Bars represent the mean and error bars represent the standard deviations for n=3 independent experiments. A Tukey’s multiple comparison test was performed comparing each treatment and different medium conditions and p-values are represented by n.s. for not significant * for p-value <0.05, ** for p-value <0.01 and *** for p-value <0.001.

